


Published on Mar 21, 2016
Updated on Oct 16, 2019
Create superior customer experiences to enhance competitive advantage.
Go from zero to breakthrough with scalable, future-proof solutions.
Harness deep tech for smarter solutions and maximum impact.
Accelerate value delivery with powerful pre-built digital tools.
Help businesses connect with an internet first generation.
Test the smarter way: where precision meets efficiency.
Unlock real-time and personalized customer journeys for mobile first generation.
Turn data into decisive action with scalable AI infrastructure.
Design agile digital foundations that scale with tomorrow's business needs.
Build new-age architecture for maximum efficiency and hyper-growth.
Fine-tune your cloud infrastructure for peak performance.
Automated compliance and control for global regulations.

All
Customer Experience
Mantra
Application Development
Insurtech
Digital Health
Insurance
Deep-Tech
AgriTech(1)
Augmented Reality(21)
Clean Tech(9)
Customer Journey(17)
Design(45)
Solar Industry(8)
User Experience(68)
Edtech(10)
Events(34)
HR Tech(3)
Interviews(10)
Life@mantra(11)
Logistics(6)
Manufacturing(5)
Strategy(18)
Testing(9)
Android(48)
Backend(32)
Dev Ops(11)
Enterprise Solution(33)
Technology Modernization(9)
Frontend(29)
iOS(43)
Javascript(15)
AI in Insurance(41)
Insurtech(67)
Product Innovation(59)
Solutions(22)
E-health(12)
HealthTech(25)
mHealth(5)
Telehealth Care(4)
Telemedicine(5)
Artificial Intelligence(154)
Bitcoin(8)
Blockchain(19)
Cognitive Computing(8)
Computer Vision(8)
Data Science(24)
FinTech(51)
Banking(7)
Intelligent Automation(27)
Machine Learning(48)
Natural Language Processing(14)
To gain insight into the state of development, every year tens of thousands of developers are surveyed by Stack Overflow through their service. Stack Overflow serves as a stage where designers share their work and make inquiries identified with coding. Consistently, the site overviews a huge number of engineers to get a thought regarding the present situation of the tech world, making it a standout amongst the most exhaustive designer study ever directed.
Every year the statistics of inside industry are fascinating and this year for 2016’s study, 50,000 to 56033 developers responded from across the industry from 173 countries– and the findings are fascinating, as well as insightful. The company found that JavaScript is still overwhelmingly the most popular development language, with more than 55.4 percent of people saying they use the language. PHP fell 4 percent in the last year to 25 percent, which Stack Overflow attributed to the rise of Node and Angular, but Microsoft’s Visual Basic is the most “dreaded” language. It was also found that 46 percent of the developers have no degree in computer science or any related field and that more than 57 percent of them check in code at work more than once a day.
Survey statistics of January 2016 showed, more than 45 million opened Stack Overflow in their web programs to pose a question or answer something asked by a kindred designer. Most respondents recognize themselves as full-stack designers with a number as high as 28%, trailed by back-end web engineers with 12.2%.
Among overall participants, the most popular developer job title was “Full-Stack Web Developer” at 28 percent, followed by “back-end developer” at 12 percent and around 11.4% percent call themselves an understudy, trailed by 8.4% developers who are Android, iOS, Windows Phone, and multi-stage development developers. Interestingly the most common developer age is 25-29, with more than 28 percent of respondents fitting into the category, followed by 23 percent at 20-25.
Stack overflow engineer overview 2016 designer occupations: 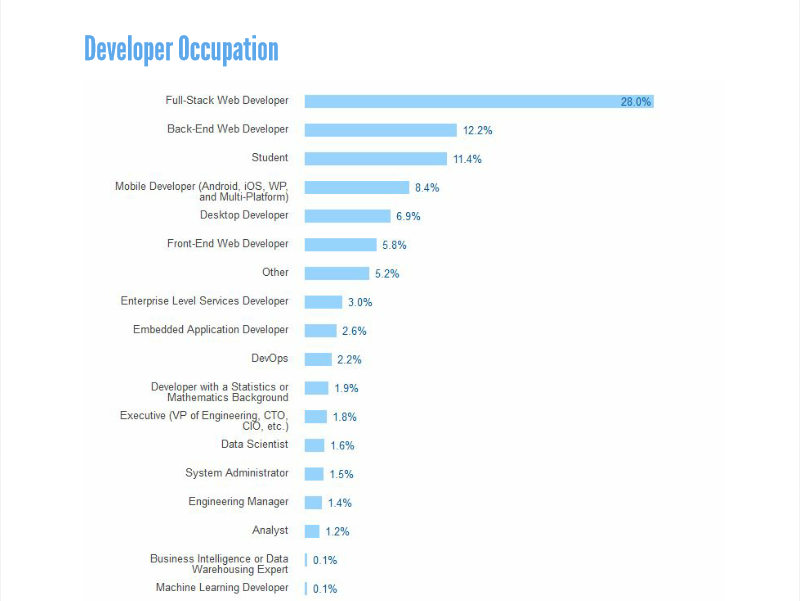
If we move to the area where we’ll discuss the most utilized advances, JavaScript keeps on decision the web. It’s still the most mainstream programming dialect for web advancement with 55.4% individuals saying that they code in JavaScript. This colossally famous programming dialect is trailed by SQL Server (49.1%), Java (36.3%), C# (30.9%), PHP (25.9%), and C++ (19.4%).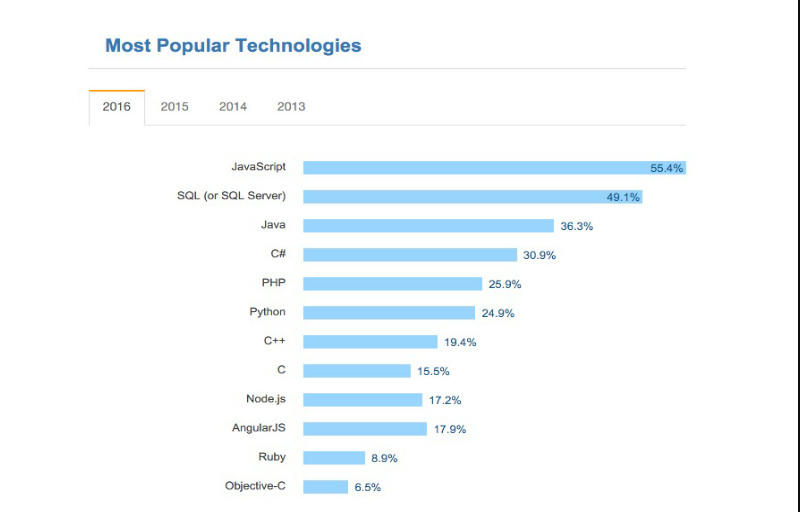
In “Stack Overflow engineer review 2016 most prevalent technologies”, if we discuss the inclining advancements on Stack Overflow, React, Spark and Swift (taking business sector from Objective-C ‘quickly’) are administering the graphs, while Node.js and Angular JS are on the rise.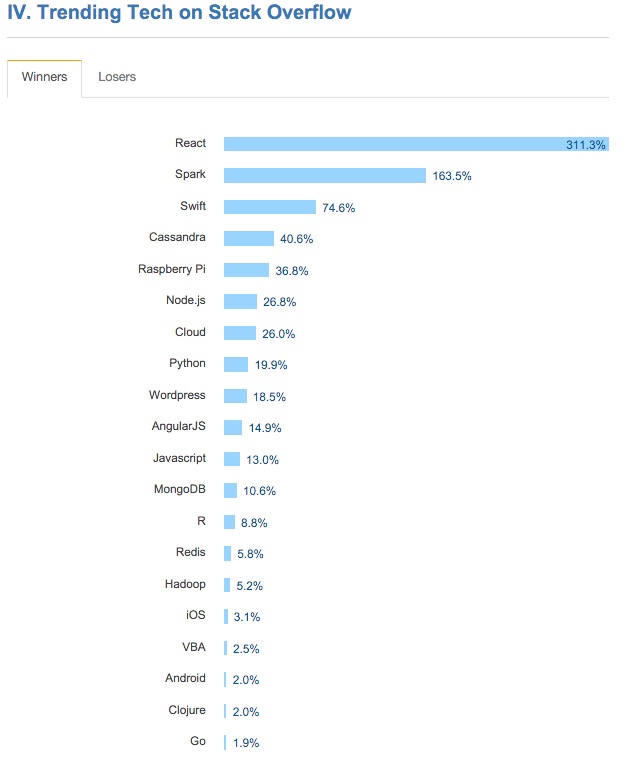
This year we asked respondents if they are Engineers, Experts, Hackers or any of the other descriptors we’ve frequently seen in job listings, business cards, and Twitter bios.
95% of developers identify as either a Developer, Programmer, Engineer, Senior Developer or Full-Stack Developer. Embedded Application Developers are most likely to identify as Engineers. Graphics Programmers are most likely to identify as Programmers.
But Developer is the runaway choice in this survey.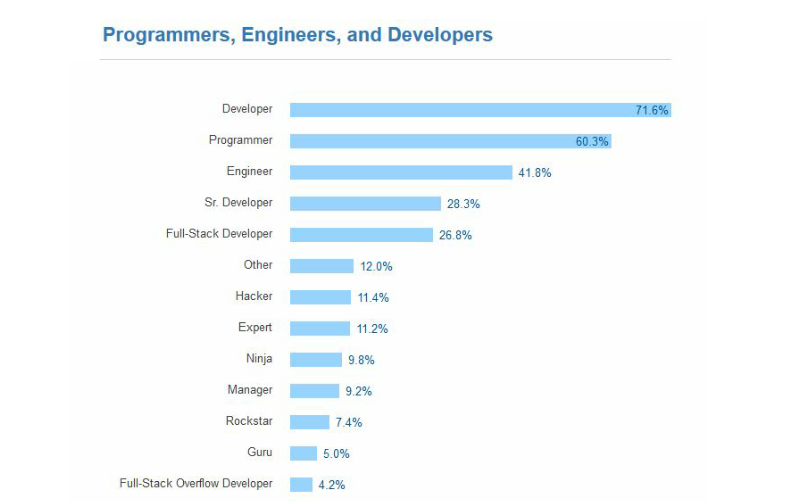
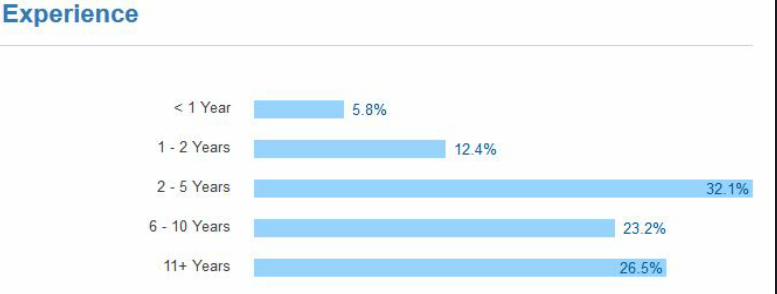
The average developer has about 6.5 years of IT or programming experience. This isn’t necessarily professional experience (the average student tells us they have 3.4 years of experience). Developers gain experience by building things, even if they’re doing it unpaid or part-time. We’ve found this experience distribution to closely match that of more than 230,000 developers who make their CVs available on Stack Overflow.
Worldwide, the median Front-End Web Developer has 3.5 years of experience. The median Full-Stack Developer has 8 years of experience. And the median Engineering Manager has 13 years of experience.
The other points that were highlighted in Survey were, 69% of all developers tell us they are at least partly self-taught. (13% of respondents across the globe tell us they are only self-taught.) 43% of developers have either a BA or BS in computer science or a related field. 2% of developers have a PhD.
Overall, about 73% of developers tell us they think diversity is at least somewhat important in the workplace. 41% of developers say diversity is very important. And developers who most often influence hiring decisions are more likely to believe in the value of diversity than other developer types.
The saddest statistic in the Survey document, which has been highlighted as a major issue at many silicon valley tech companies, is that more than 92 percent of the respondents were male, showing just how gendered the industry really is and how far we need to go.
The study provides a lot of other interesting data if you’re looking for insights into where to move next, or if you’re looking for an easy pay bump. Mantra Labs has been continuously keeping watch on latest trends in Tech companies, to know more about latest trends, connect to Mantra Labs.
Knowledge thats worth delivered in your inbox
Smart Manufacturing starts with real-time visibility.
Manufacturing companies today generate data by the second through sensors, machines, ERP systems, and MES platforms. But without real-time insights, even the most advanced production lines are essentially flying blind.
Manufacturers are implementing real-time dashboards that serve as control towers for their daily operations, enabling them to shift from reactive to proactive decision-making. These tools are essential to the evolution of Smart Manufacturing, where connected systems, automation, and intelligent analytics come together to drive measurable impact.
Data is available, but what’s missing is timely action.
For many plant leaders and COOs, one challenge persists: operational data is dispersed throughout systems, delayed, or hidden in spreadsheets. And this delay turns into a liability.
Real-time dashboards help uncover critical answers:
By converting raw inputs into real-time manufacturing analytics, dashboards make operational intelligence accessible to operators, supervisors, and leadership alike, enabling teams to anticipate problems rather than react to them.
Line performance and downtime trends
Track OEE in real time and identify underperforming lines.
Predictive maintenance alerts
Utilize historical and sensor data to identify potential part failures in advance.
Inventory heat maps & reorder thresholds
Anticipate stockouts or overstocks based on dynamic reorder points.
Quality metrics linked to operator actions
Isolate shifts or procedures correlated with spikes in defects or rework.
These insights allow production teams to drive day-to-day operations in line with Smart Manufacturing principles.
Role-based dashboards
Dashboards can be configured for machine operators, shift supervisors, and plant managers, each with a tailored view of KPIs.
Embedded alerts and nudges
Real-time prompts, like “Line 4 below efficiency threshold for 15+ minutes,” reduce response times and minimize disruptions.
Cross-functional drill-downs
Teams can identify root causes more quickly because users can move from plant-wide overviews to detailed machine-level data in seconds.
Data lakehouse integration
Unified access to ERP, MES, IoT sensor, and QA systems—ensuring reliable and timely manufacturing analytics.
ETL pipelines
Real-time data ingestion from high-frequency sources with minimal latency.
Visualization tools
Custom builds using Power BI, or customized solutions designed for frontline usability and operational impact.
Mantra Labs partnered with a North American die-casting manufacturer to unify its operational data into a real-time dashboard. Fragmented data, manual reporting, delayed pricing decisions, and inconsistent data quality hindered operational efficiency and strategic decision-making.
As this case shows, real-time dashboards are not just operational tools—they’re strategic enablers.
(Learn More: Powering the Future of Metal Manufacturing with Data Engineering)
| Aspect | What You Should Know |
| 1. Why Static Reports Fall Short | Delayed insights after issues occur Disconnected systems (ERP, MES, sensors) No real-time alerts or embedded decision logic |
| 2. What Real-Time Dashboards Enable | Track OEE and downtime in real-time Predictive maintenance using sensor data Dynamic inventory heat maps Quality linked to operators |
| 3. Dashboards That Drive Action | Role-based views (operator to CEO) Embedded alerts like “Line 4 down for 15+ mins” Drilldowns from plant-level to machine-level |
| 4. What Powers These Dashboards | Unified Data Lakehouse (ERP + IoT + MES) Real-time ETL pipelines Power BI or custom dashboards built for frontline usability |
Smart Manufacturing dashboards aren’t just analytics tools—they’re productivity engines. Dashboards that deliver real-time insight empower frontline teams to make faster, better decisions—whether it’s adjusting production schedules, triggering preventive maintenance, or responding to inventory fluctuations.
Explore how Mantra Labs can help you unlock operations intelligence that’s actually usable.
Knowledge thats worth delivered in your inbox


Our Sales Team will be in touch with you shortly.

Hello Stranger! Please fill in a few details,and you’ll receive a link to this case study.
 We have mailed you this case study.
Thanks for subscribing.
