Astronaut loading animation Circular loading bar

Try : Insurtech, Application Development

AgriTech(1)

Augmented Reality(20)

Clean Tech(5)

Customer Journey(12)

Design(36)

Solar Industry(6)

User Experience(56)

Edtech(10)

Events(34)

HR Tech(2)

Interviews(10)

Life@mantra(11)

Logistics(5)

Strategy(17)

Testing(9)

Android(47)

Backend(30)

Dev Ops(7)

Enterprise Solution(27)

Technology Modernization(2)

Frontend(28)

iOS(43)

Javascript(15)

AI in Insurance(35)

Insurtech(63)

Product Innovation(49)

Solutions(19)

E-health(10)

HealthTech(22)

mHealth(5)

Telehealth Care(4)

Telemedicine(5)

Artificial Intelligence(132)

Bitcoin(8)

Blockchain(19)

Cognitive Computing(7)

Computer Vision(8)

Data Science(17)

FinTech(50)

Banking(7)

Intelligent Automation(26)

Machine Learning(47)

Natural Language Processing(14)

expand Menu Filters

Role of ETL in Business Intelligence

ETL (Extract, Transform, Load) is a process of extracting data from different data sources; manipulating them according to business calculations; loading the modified data into a different data warehouse. Because of the in-depth analytics data it provides, ETL function lies at the core of Business Intelligence systems. With ETL, enterprises can obtain historical, current, and predictive views of real business data. Let’s look at some ETL features that are necessary for business intelligence.
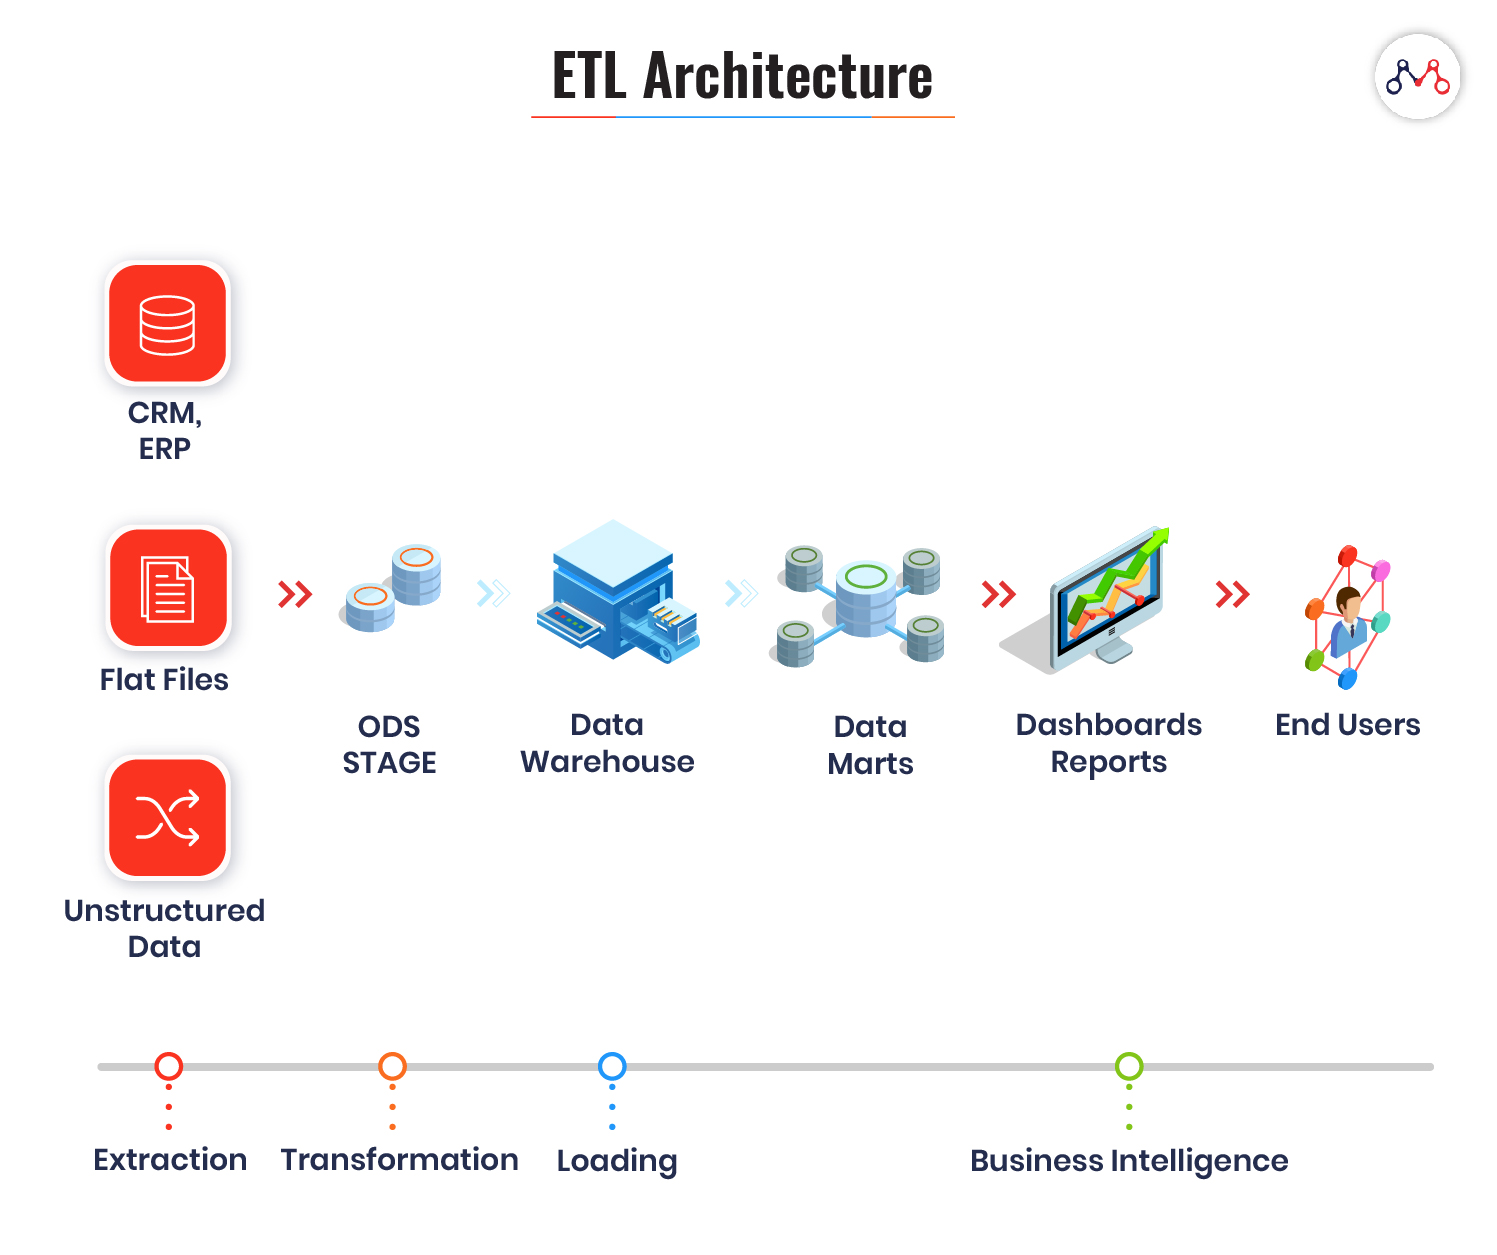
Extraction Transformation Loading

The Importance of ETL in Business Intelligence

Businesses rely on the ETL process for a consolidated data view that can drive better business decisions. The following ETL features justify the point.

High-level Data Mapping

Leveraging data and transforming them into actionable insights is a challenge with dispersed and voluminous data. Data mapping simplifies database functionalities like integration, migration, warehousing, and transformation.

ETL allows mapping data for specific applications. Data mapping helps in establishing a correlation between different data models.

Data Quality & Big Data Analytics

Huge volumes of data aren’t of much use in their raw form. Applying algorithms on raw data often leads to ambiguous results. It needs structuring, analyzing, and interpreting well to gain powerful insights. ETL also ensures the quality of data in the warehouse through standardization and removing duplicates.

ETL tools combine data integration and processing, making it easier to deal with voluminous data. In its data integration module, ETL assembles data from disparate sources. Post integration, it applies business rules to provide the analytics view of the data.

[Also read: Popular ETL Tools for 2020]

Automatic & Faster Batch Data Processing

The modern-day ETL tools run on scripts, which are faster than traditional programming. Scripts are a lightweight set of instructions that execute specific tasks in the background. ETL also ‘batch’ processes data like moving huge volumes of data between two systems in a set schedule.

Sometimes the volume of incoming data increases to millions of events per second. To handle such situations, stream processing (monitoring and batch processing data) can help in timely decision making. For example, Banks batch process the data generally during night hours to resolves the entire day’s transactions.

Master Data Management

Using ETL and data integration, enterprises can obtain the “best data view” across multiple sources.

How ETL Works?

ETL systems are designed to accomplish three complex database functions: extract, transform and load.

#1 Extraction

Here, a module extracts data from different data sources independent of file formats. For instance, banking and insurance technology platforms operate on different databases, hardware, operating system, and communication protocols. Also, their system derives data from a variety of touchpoints like ATMs, text files, pdfs, spreadsheets, scanned forms, etc. The extraction phase maps the data from different sources into a unified format before processing. 
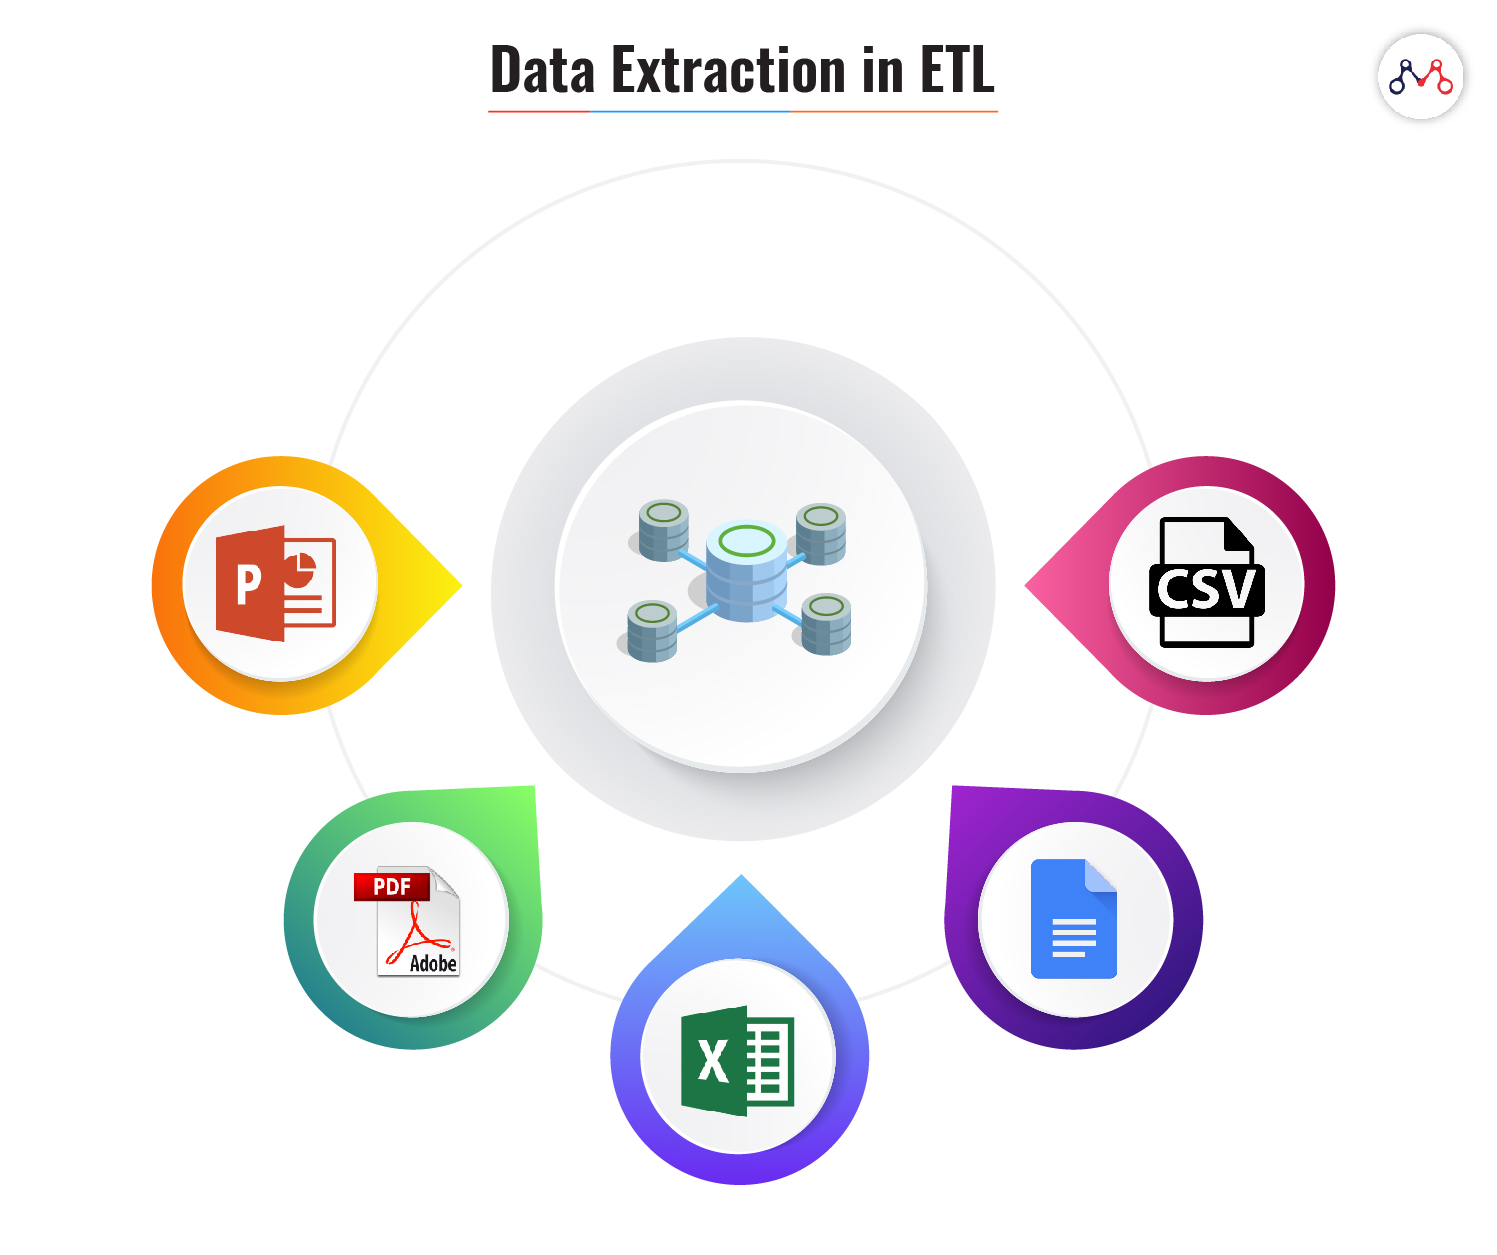
Data-extraction-in-ETL

ETL systems ensure the following while extracting data.

  1. Removing redundant (duplicate) or fragmented data
  2. Removing spam or unwanted data
  3. Reconciling records with source data
  4. Checking data types and key attributes.

#2 Transformation

This stage involves applying algorithms and modifying data according to business-specific rules. The common operations performed in ETL’s transformation stage is computation, concatenation, filters, and string operations like currency, time, data format, etc. It also validates the following-

  1. Data cleaning like adding ‘0’ to null values
  2. Threshold validation like age cannot be more than two digits
  3. Data standardization according to the rules and lookup table.
Data-transformation-in-ETL

#3 Loading

Loading is a process of migrating structured data into the warehouse. Usually, large volumes of data need to be loaded in a short time. ETL applications play a crucial role in optimizing the load process with efficient recovery mechanisms for the instances of loading failures.

A typical ETL process involves three types of loading functions-

  1. Initial load: it populates the records in the data warehouse.
  2. Incremental load: it applies changes (updates) periodically as per the requirements.
  3. Full refresh: It reloads the warehouse with fresh records by erasing the old contents.

The ETL systems validate the following data loading parameters-

  • The Business Intelligence report on view layer matches with the loaded facts
  • Data consistency between the data warehouse and the history table.
  • Models are based on transformed data and not the raw data from the original databases.

The modern-day ETL applications utilize NoSQL database systems for warehousing. NoSQL systems are suitable for big-data and real-time web-applications. NoSQL executes queries faster than traditional databases and is more memory efficient.

ETL Business Applications

Transactional databases are not enough to resolve complex business queries. Also, dealing with unorganized data formats is more time-taking. ETL can help in obtaining-

  • Memory efficiency
  • Real-time query processing
  • Mapping data historical, current, and predictive data to derive actionable insights
  • Smart data storage and retrieval.

Almost all industries can deploy the benefits of ETL systems. However, businesses like banking, insurance, customer relations, finance, and healthcare are the early adopters of this technology.

If your business needs intelligent data processing, we’re here to listen to your requirements. Drop us a word at hello@mantralabsglobal.com to know about our previous works on developing ETL applications.

Cancel

Knowledge thats worth delivered in your inbox

10 Analytics Tools to Guide Data-Driven Design

Analytics are essential for informing website redesigns since they offer insightful data on user behavior, website performance, and areas that may be improved. Here is a list of frequently used analytics tools to guide data-driven design that can be applied at different stages of the website redesign process. 

Analytics Tools to Guide Data-Driven Design

1. Google Analytics:

Use case scenario: Website Audit, Research, Analysis, and Technical Assessment
Usage: Find popular sites, entry/exit points, and metrics related to user engagement by analyzing traffic sources, user demographics, and behavior flow. Recognize regions of friction or pain points by understanding user journeys. Evaluate the performance of your website, taking note of conversion rates, bounce rates, and page load times.

2. Hotjar:

Use case scenario: Research, Analysis, Heat Maps, User Experience Evaluation
Usage: Use session recordings, user surveys, and heatmaps to learn more about how people interact with the website. Determine the high and low engagement regions and any usability problems, including unclear navigation or form abandonment. Utilizing behavior analysis and feedback, ascertain the intentions and preferences of users.

3. Crazy Egg:
Use case scenario: Website Audit, Research, Analysis
Usage: Like Hotjar, with Crazy Egg, you can create heatmaps, scrollmaps, and clickmaps to show how users interact with the various website elements. Determine trends, patterns, and areas of interest in user behaviour. To evaluate various design aspects and gauge their effect on user engagement and conversions, utilize A/B testing functionalities.

4. SEMrush:

Use case scenario: Research, Analysis, SEO Optimization
Usage: Conduct keyword research to identify relevant search terms and phrases related to the website’s content and industry. Analyze competitor websites to understand their SEO strategies and identify opportunities for improvement. Monitor website rankings, backlinks, and organic traffic to track the effectiveness of SEO efforts.

5. Similarweb:
Use case
scenario: Research, Website Traffic, and Demography, Competitor Analysis
Usage: By offering insights into the traffic sources, audience demographics, and engagement metrics of competitors, Similarweb facilitates website redesigns. It influences marketing tactics, SEO optimization, content development, and decision-making processes by pointing out areas for growth and providing guidance. During the research and analysis stage, use Similarweb data to benchmark against competitors and guide design decisions.

6. Moz:
Use case scenario: Research, Analysis, SEO Optimization
Usage: Conduct website audits in order to find technical SEO problems like missing meta tags, duplicate content, and broken links. Keep an eye on a website’s indexability and crawlability to make sure search engines can access and comprehend its material. To find and reject backlinks that are spammy or of poor quality, use link analysis tools.

7. Ahrefs:
Use case scenario:
Research, Analysis, SEO Optimization

Usage: Examine the backlink profiles of your rivals to find any gaps in your own backlink portfolio and possible prospects for link-building. Examine the performance of your content to find the most popular pages and subjects that appeal to your target market. Track social media activity and brand mentions to gain insight into your online reputation and presence.

8. Google Search Console:

Use case scenario: Technical Assessment, SEO Optimization
Usage: Monitor website indexing status, crawl errors, and security issues reported by Google. Submit XML sitemaps and individual URLs for indexing. Identify and fix mobile usability issues, structured data errors, and manual actions that may affect search engine visibility.

9. Adobe Analytics:
Use case scenario:
Website Audit, Research, Analysis,
Usage: Track user interactions across multiple channels and touchpoints, including websites, mobile apps, and offline interactions. Segment users based on demographics, behavior, and lifecycle stage to personalize marketing efforts and improve user experience. Utilize advanced analytics features such as path analysis, cohort analysis, and predictive analytics to uncover actionable insights.

10. Google Trends:

Use case scenario: Content Strategy, Keyword Research, User Intent Analysis
Usage: For competitor analysis, user intent analysis, and keyword research, Google Trends is used in website redesigns. It helps in content strategy, seasonal planning, SEO optimization, and strategic decision-making. It directs the production of user-centric content, increasing traffic and engagement, by spotting trends and insights.

About the Author:

Vijendra is currently working as a Sr. UX Designer at Mantra Labs. He is passionate about UXR and Product Design.

Cancel

Knowledge thats worth delivered in your inbox

Loading More Posts ...
Go Top
ml floating chatbot