


Published on Apr 14, 2016
Updated on Oct 16, 2019
Create superior customer experiences to enhance competitive advantage.
Go from zero to breakthrough with scalable, future-proof solutions.
Harness deep tech for smarter solutions and maximum impact.
Accelerate value delivery with powerful pre-built digital tools.
Help businesses connect with an internet first generation.
Test the smarter way: where precision meets efficiency.
Unlock real-time and personalized customer journeys for mobile first generation.
Turn data into decisive action with scalable AI infrastructure.
Design agile digital foundations that scale with tomorrow's business needs.
Build new-age architecture for maximum efficiency and hyper-growth.
Fine-tune your cloud infrastructure for peak performance.
Automated compliance and control for global regulations.

All
Customer Experience
Mantra
Application Development
Insurtech
Digital Health
Insurance
Deep-Tech
AgriTech(1)
Augmented Reality(21)
Clean Tech(9)
Customer Journey(17)
Design(45)
Solar Industry(8)
User Experience(68)
Edtech(10)
Events(34)
HR Tech(3)
Interviews(10)
Life@mantra(11)
Logistics(6)
Manufacturing(5)
Strategy(18)
Testing(9)
Android(48)
Backend(32)
Dev Ops(11)
Enterprise Solution(33)
Technology Modernization(9)
Frontend(29)
iOS(43)
Javascript(15)
AI in Insurance(41)
Insurtech(67)
Product Innovation(59)
Solutions(22)
E-health(12)
HealthTech(25)
mHealth(5)
Telehealth Care(4)
Telemedicine(5)
Artificial Intelligence(154)
Bitcoin(8)
Blockchain(19)
Cognitive Computing(8)
Computer Vision(8)
Data Science(24)
FinTech(51)
Banking(7)
Intelligent Automation(27)
Machine Learning(48)
Natural Language Processing(14)
Android Studio 2.0 is the fastest way to build high quality, perform-ant apps for the Android platform, including phones and tablets, Android Auto, Android Wear, and Android TV. As the official IDE from Google, Android Studio includes everything you need to build an app, including a code editor, code analysis tools, emulators and more. This new and stable version of Android Studio has fast build speeds and a fast emulator with support for the latest Android version and Google Play Services.
Android Studio is built in coordination with the Android platform and supports all of the latest and greatest APIs. If you are developing for Android, you should be using Android Studio 2.0. It is available today as a easy download or update on the stable release channel.
Android Studio 2.0 includes the following new features that Android developer can use in their workflow :
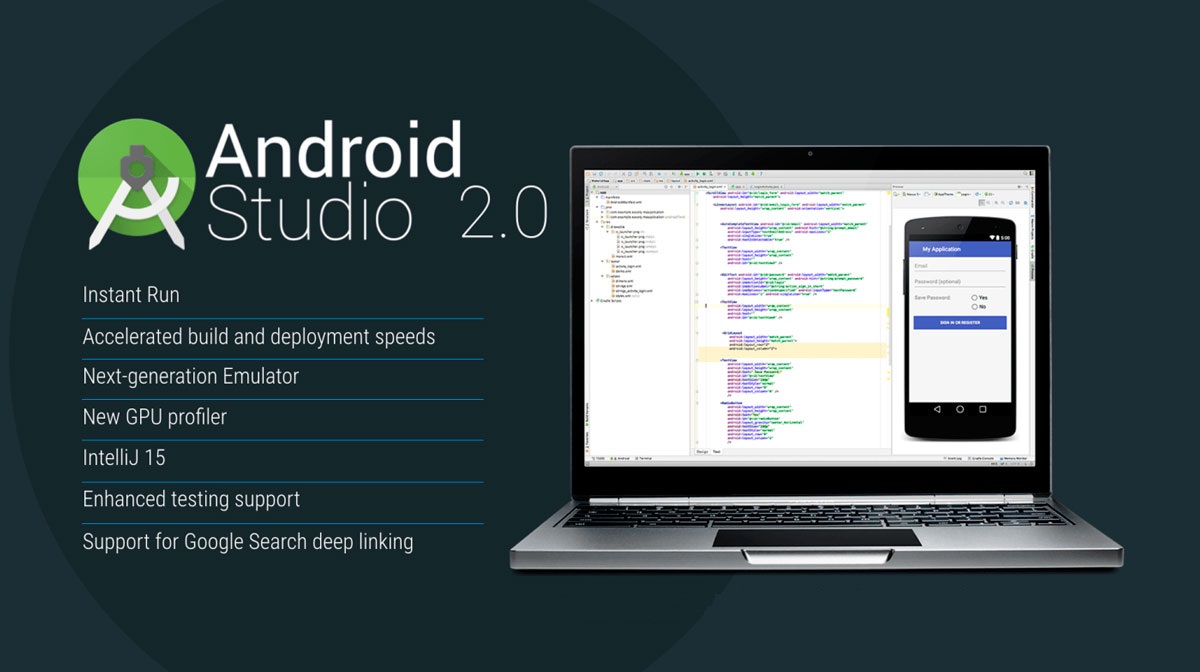
Here is the full feature Android Studio 2.0 features- Developers Preview:
Instant Run: This feature is supposed to dramatically improve your workflow by letting you quickly see changes running on your device or emulator. It lets you see your changes running “in a near instant,” which means you can continuously code and run your app, hopefully accelerating your edit, build, run cycles. When you click on the Instant Run button, it will analyze the changes you have made and determine how it can deploy your new code in the fastest way. Instant Run works with any Android Device or emulator running API 14 (Ice Cream Sandwich) or higher.
Android Emulator: The new Android Emulator is up to 3x faster in CPU, RAM, and I/O in comparison to the previous Android emulator. ADB push speeds are 10x faster. In fact, developing on the official Android Emulator is faster than a real device in most situations. It also has a new user interface and sensor controls, letting you you drag and drop APKs for quick installation, resize and rescale the window, use multi-touch actions (pinch & zoom, pan, rotate, tilt), and so on.
Cloud Test Lab: This new service allows you to test your app across a wide range of devices and device configurations. Google sees it as an extension to your testing process that lets you run through a collection of tests against a portfolio of physical devices hosted in Google’s data centers. Even if you do not have tests explicitly written, Cloud Test Lab can perform a basic set of crash tests, right from Android Studio.
App Indexing: It is now easier for your users to find your app in Google Search with the App Indexing API. Android Studio 2.0 helps you to create the correct URL structure in your app code and add attributes in your AndroidManifest.xml file that will work with the Google App Indexing service. You can then test and validate your app indexing code in Android Studio.
GPU Debugger Preview: If you are developing OpenGL ES games or graphics-intensive apps, you have a new GPU debugger (in preview) in Android Studio 2.0. It can step through your app frame by frame to identify and debug graphics rendering issues with information about the GL state.
If you are using a previous version of Android Studio, you can get the latest version in the navigation menu (Help => Check for Update on Windows/Linux and Android Studio => Check for Updates on OS X). Either download directly from the link given below:
To Download Android Studio 2.0 For Windows: Click Here (320 MB)
To Download Android Studio 2.0 For Mac: Click here (319 MB)
Mantra Labs deep dives into latest trends and innovations in the Web, Mobile, Enterprise and Internet of Things space. The insights generated from these studies helps us provide more value for our clients.
Knowledge thats worth delivered in your inbox
Smart Manufacturing starts with real-time visibility.
Manufacturing companies today generate data by the second through sensors, machines, ERP systems, and MES platforms. But without real-time insights, even the most advanced production lines are essentially flying blind.
Manufacturers are implementing real-time dashboards that serve as control towers for their daily operations, enabling them to shift from reactive to proactive decision-making. These tools are essential to the evolution of Smart Manufacturing, where connected systems, automation, and intelligent analytics come together to drive measurable impact.
Data is available, but what’s missing is timely action.
For many plant leaders and COOs, one challenge persists: operational data is dispersed throughout systems, delayed, or hidden in spreadsheets. And this delay turns into a liability.
Real-time dashboards help uncover critical answers:
By converting raw inputs into real-time manufacturing analytics, dashboards make operational intelligence accessible to operators, supervisors, and leadership alike, enabling teams to anticipate problems rather than react to them.
Line performance and downtime trends
Track OEE in real time and identify underperforming lines.
Predictive maintenance alerts
Utilize historical and sensor data to identify potential part failures in advance.
Inventory heat maps & reorder thresholds
Anticipate stockouts or overstocks based on dynamic reorder points.
Quality metrics linked to operator actions
Isolate shifts or procedures correlated with spikes in defects or rework.
These insights allow production teams to drive day-to-day operations in line with Smart Manufacturing principles.
Role-based dashboards
Dashboards can be configured for machine operators, shift supervisors, and plant managers, each with a tailored view of KPIs.
Embedded alerts and nudges
Real-time prompts, like “Line 4 below efficiency threshold for 15+ minutes,” reduce response times and minimize disruptions.
Cross-functional drill-downs
Teams can identify root causes more quickly because users can move from plant-wide overviews to detailed machine-level data in seconds.
Data lakehouse integration
Unified access to ERP, MES, IoT sensor, and QA systems—ensuring reliable and timely manufacturing analytics.
ETL pipelines
Real-time data ingestion from high-frequency sources with minimal latency.
Visualization tools
Custom builds using Power BI, or customized solutions designed for frontline usability and operational impact.
Mantra Labs partnered with a North American die-casting manufacturer to unify its operational data into a real-time dashboard. Fragmented data, manual reporting, delayed pricing decisions, and inconsistent data quality hindered operational efficiency and strategic decision-making.
As this case shows, real-time dashboards are not just operational tools—they’re strategic enablers.
(Learn More: Powering the Future of Metal Manufacturing with Data Engineering)
| Aspect | What You Should Know |
| 1. Why Static Reports Fall Short | Delayed insights after issues occur Disconnected systems (ERP, MES, sensors) No real-time alerts or embedded decision logic |
| 2. What Real-Time Dashboards Enable | Track OEE and downtime in real-time Predictive maintenance using sensor data Dynamic inventory heat maps Quality linked to operators |
| 3. Dashboards That Drive Action | Role-based views (operator to CEO) Embedded alerts like “Line 4 down for 15+ mins” Drilldowns from plant-level to machine-level |
| 4. What Powers These Dashboards | Unified Data Lakehouse (ERP + IoT + MES) Real-time ETL pipelines Power BI or custom dashboards built for frontline usability |
Smart Manufacturing dashboards aren’t just analytics tools—they’re productivity engines. Dashboards that deliver real-time insight empower frontline teams to make faster, better decisions—whether it’s adjusting production schedules, triggering preventive maintenance, or responding to inventory fluctuations.
Explore how Mantra Labs can help you unlock operations intelligence that’s actually usable.
Knowledge thats worth delivered in your inbox


Our Sales Team will be in touch with you shortly.

Hello Stranger! Please fill in a few details,and you’ll receive a link to this case study.
 We have mailed you this case study.
Thanks for subscribing.
