


Published on May 24, 2016
Updated on Oct 16, 2019
Create superior customer experiences to enhance competitive advantage.
Go from zero to breakthrough with scalable, future-proof solutions.
Harness deep tech for smarter solutions and maximum impact.
Accelerate value delivery with powerful pre-built digital tools.
Help businesses connect with an internet first generation.
Test the smarter way: where precision meets efficiency.
Unlock real-time and personalized customer journeys for mobile first generation.
Turn data into decisive action with scalable AI infrastructure.
Design agile digital foundations that scale with tomorrow's business needs.
Build new-age architecture for maximum efficiency and hyper-growth.
Fine-tune your cloud infrastructure for peak performance.
Automated compliance and control for global regulations.

All
Customer Experience
Mantra
Application Development
Insurtech
Digital Health
Insurance
Deep-Tech
AgriTech(1)
Augmented Reality(21)
Clean Tech(9)
Customer Journey(17)
Design(45)
Solar Industry(8)
User Experience(68)
Edtech(10)
Events(34)
HR Tech(3)
Interviews(10)
Life@mantra(11)
Logistics(6)
Manufacturing(5)
Strategy(18)
Testing(9)
Android(48)
Backend(32)
Dev Ops(11)
Enterprise Solution(33)
Technology Modernization(9)
Frontend(29)
iOS(43)
Javascript(15)
AI in Insurance(41)
Insurtech(67)
Product Innovation(59)
Solutions(22)
E-health(12)
HealthTech(25)
mHealth(5)
Telehealth Care(4)
Telemedicine(5)
Artificial Intelligence(154)
Bitcoin(8)
Blockchain(19)
Cognitive Computing(8)
Computer Vision(8)
Data Science(24)
FinTech(51)
Banking(7)
Intelligent Automation(27)
Machine Learning(48)
Natural Language Processing(14)
Angular 2 is a big upgrade from Angular 1. It is a framework for mobile apps and can be used for desktop as well. Like Angular 1, Angular 2 (currently in alpha) is built on a set of concepts that are used throughout the framework and they would be used directly or, indirectly while writing applications.
Angular 2 separates updating the application model and reflecting the state of the model in the view into two distinct phases. The developer is responsible for updating the application model. Angular, by means of change detection, is responsible for reflecting the state of the model in the view. The framework does it automatically on every VM turn.
Angular 2 Features:
Component-based UI
Angular is adopting a component-based UI, a concept that might be familiar to React developers. In a sense, the Angular 1.x controllers and directives blur into the new Angular 2 Component. This means that in Angular 2 there are no controllers and no directives. Instead, a component has a selector which corresponds to the html tag that the component will represent and View to specify an HTML template for the component to populate.
User Input with the Event Syntax
Angular 2 applications now respond to user input by using the event syntax. The event syntax is denoted by an action surrounded by parenthesis (event). You can also make element references available to other parts of the template as a local variable using the #var syntax.
Goodbye $scope
Even though ‘$scope’ has been replaced by “controller as” as a best practice since Angular 1.2, it still lingers in many tutorials. Angular 2 finally kills it off, as properties are bound to components.
Better Performance
With an ultra fast change detection and immutable data structures, Angular 2 promises to be both faster and more memory efficient. Also, the introduction of uni-directional data flow, popularized by Flux, helps to ease some of the concern in debugging performance issues with an Angular app. This also means no more two-way data binding which was a popular feature in Angular 1.x. Not to worry, even though ng-model is no more, the same concept can be solved in a similar way with Angular 2.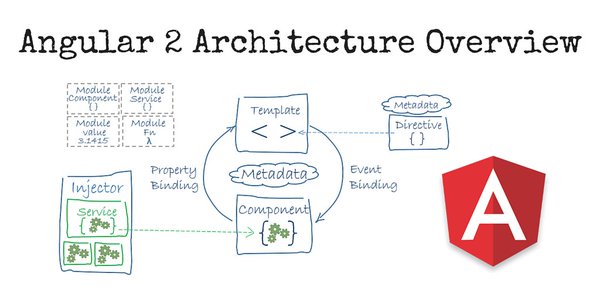
In any front-end web, frameworks is the technique used for change detection. Angular 2 adds a powerful and much flexible technique to detect changes on the objects used in the application. In Angular 1, the only way the framework detects changes, is through dirty checking. Whenever digest cycle runs in Angular 1, the framework checks for changes on all objects bound to the view and it applies the changes wherever they are needed. The same technique is used for any kind of objects. In AngularJS 2, we don’t have a chance to leverage the powers available in objects – like observable and immutable. Angular 2 opens this channel by providing a change detection system that understands the type of the object being used.
In addition, the change detectors in Angular 2 follow a tree structure to detect changes. This makes the system predictable and it reduces the time taken to detect changes.
If plain JavaScript objects are used to bind data on the views, Angular 2 has to go through each node and check for changes on the nodes, with each browser event. Though it sounds similar to the technique in Angular 1 but the checks happen very fast as the system has to parse a tree in a known order. If we use Observables or, Immutable objects instead of the plain mutable objects, the framework understands them and provides better change detection.
Angular 2 is written from the ground-up using the latest features available in the web ecosystem and it brings several significant improvements over the framework’s older version. While it retires a number of Angular 1 features, it also adopts a number of core concepts and principles from an older version of the framework.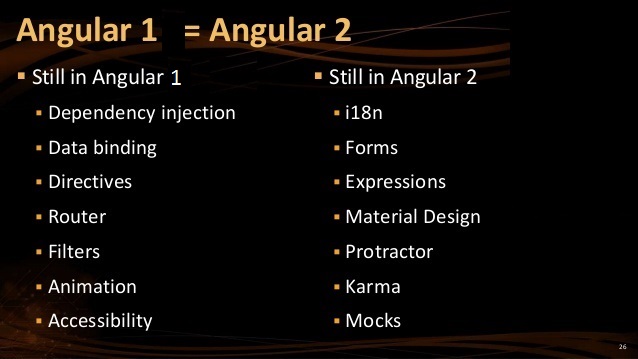
Short Summary:
The team has collaborated with the TypeScript team at Microsoft, both the teams are working really hard to create a great framework and they are also working with TC39 team to make JavaScript a better language. The best is yet to come and hence the future is going to be exciting for all developers.
In case, you have any queries on Angular 2 framework, feel free to approach us on hello@mantralabsglobal.com, our developers are here to clear confusions and it might be a good choice based on your business and technical needs.
Knowledge thats worth delivered in your inbox
Smart Manufacturing starts with real-time visibility.
Manufacturing companies today generate data by the second through sensors, machines, ERP systems, and MES platforms. But without real-time insights, even the most advanced production lines are essentially flying blind.
Manufacturers are implementing real-time dashboards that serve as control towers for their daily operations, enabling them to shift from reactive to proactive decision-making. These tools are essential to the evolution of Smart Manufacturing, where connected systems, automation, and intelligent analytics come together to drive measurable impact.
Data is available, but what’s missing is timely action.
For many plant leaders and COOs, one challenge persists: operational data is dispersed throughout systems, delayed, or hidden in spreadsheets. And this delay turns into a liability.
Real-time dashboards help uncover critical answers:
By converting raw inputs into real-time manufacturing analytics, dashboards make operational intelligence accessible to operators, supervisors, and leadership alike, enabling teams to anticipate problems rather than react to them.
Line performance and downtime trends
Track OEE in real time and identify underperforming lines.
Predictive maintenance alerts
Utilize historical and sensor data to identify potential part failures in advance.
Inventory heat maps & reorder thresholds
Anticipate stockouts or overstocks based on dynamic reorder points.
Quality metrics linked to operator actions
Isolate shifts or procedures correlated with spikes in defects or rework.
These insights allow production teams to drive day-to-day operations in line with Smart Manufacturing principles.
Role-based dashboards
Dashboards can be configured for machine operators, shift supervisors, and plant managers, each with a tailored view of KPIs.
Embedded alerts and nudges
Real-time prompts, like “Line 4 below efficiency threshold for 15+ minutes,” reduce response times and minimize disruptions.
Cross-functional drill-downs
Teams can identify root causes more quickly because users can move from plant-wide overviews to detailed machine-level data in seconds.
Data lakehouse integration
Unified access to ERP, MES, IoT sensor, and QA systems—ensuring reliable and timely manufacturing analytics.
ETL pipelines
Real-time data ingestion from high-frequency sources with minimal latency.
Visualization tools
Custom builds using Power BI, or customized solutions designed for frontline usability and operational impact.
Mantra Labs partnered with a North American die-casting manufacturer to unify its operational data into a real-time dashboard. Fragmented data, manual reporting, delayed pricing decisions, and inconsistent data quality hindered operational efficiency and strategic decision-making.
As this case shows, real-time dashboards are not just operational tools—they’re strategic enablers.
(Learn More: Powering the Future of Metal Manufacturing with Data Engineering)
| Aspect | What You Should Know |
| 1. Why Static Reports Fall Short | Delayed insights after issues occur Disconnected systems (ERP, MES, sensors) No real-time alerts or embedded decision logic |
| 2. What Real-Time Dashboards Enable | Track OEE and downtime in real-time Predictive maintenance using sensor data Dynamic inventory heat maps Quality linked to operators |
| 3. Dashboards That Drive Action | Role-based views (operator to CEO) Embedded alerts like “Line 4 down for 15+ mins” Drilldowns from plant-level to machine-level |
| 4. What Powers These Dashboards | Unified Data Lakehouse (ERP + IoT + MES) Real-time ETL pipelines Power BI or custom dashboards built for frontline usability |
Smart Manufacturing dashboards aren’t just analytics tools—they’re productivity engines. Dashboards that deliver real-time insight empower frontline teams to make faster, better decisions—whether it’s adjusting production schedules, triggering preventive maintenance, or responding to inventory fluctuations.
Explore how Mantra Labs can help you unlock operations intelligence that’s actually usable.
Knowledge thats worth delivered in your inbox


Our Sales Team will be in touch with you shortly.

Hello Stranger! Please fill in a few details,and you’ll receive a link to this case study.
 We have mailed you this case study.
Thanks for subscribing.
