


Published on Sep 18, 2019
Updated on Dec 13, 2019
Create superior customer experiences to enhance competitive advantage.
Go from zero to breakthrough with scalable, future-proof solutions.
Harness deep tech for smarter solutions and maximum impact.
Accelerate value delivery with powerful pre-built digital tools.
Help businesses connect with an internet first generation.
Test the smarter way: where precision meets efficiency.
Unlock real-time and personalized customer journeys for mobile first generation.
Turn data into decisive action with scalable AI infrastructure.
Design agile digital foundations that scale with tomorrow's business needs.
Build new-age architecture for maximum efficiency and hyper-growth.
Fine-tune your cloud infrastructure for peak performance.
Automated compliance and control for global regulations.

All
Customer Experience
Mantra
Application Development
Insurtech
Digital Health
Insurance
Deep-Tech
AgriTech(1)
Augmented Reality(21)
Clean Tech(9)
Customer Journey(17)
Design(45)
Solar Industry(8)
User Experience(68)
Edtech(10)
Events(34)
HR Tech(3)
Interviews(10)
Life@mantra(11)
Logistics(6)
Manufacturing(5)
Strategy(18)
Testing(9)
Android(48)
Backend(32)
Dev Ops(11)
Enterprise Solution(33)
Technology Modernization(9)
Frontend(29)
iOS(43)
Javascript(15)
AI in Insurance(41)
Insurtech(67)
Product Innovation(59)
Solutions(22)
E-health(12)
HealthTech(25)
mHealth(5)
Telehealth Care(4)
Telemedicine(5)
Artificial Intelligence(154)
Bitcoin(8)
Blockchain(19)
Cognitive Computing(8)
Computer Vision(8)
Data Science(24)
FinTech(51)
Banking(7)
Intelligent Automation(27)
Machine Learning(48)
Natural Language Processing(14)
According to Oracle’s Executive survey, 80% of leading consumer-facing businesses have already used or are planning to use chatbots by 2020. Chatbots are scalable and cost almost nothing in operation as compared to their human counterparts. But, how practical is chatbot adoption for your business? Let’s see.
Different industries can utilize chatbots to serve different purposes. Accordingly, the parameters to measure ROI may vary. For instance, marketers may consider lead generation as a criterion while the sales department takes conversions from chatbots into account. But, of course, the decision to opt for chatbots depends on specific quantifiable measures — to solve specific customer support processes.
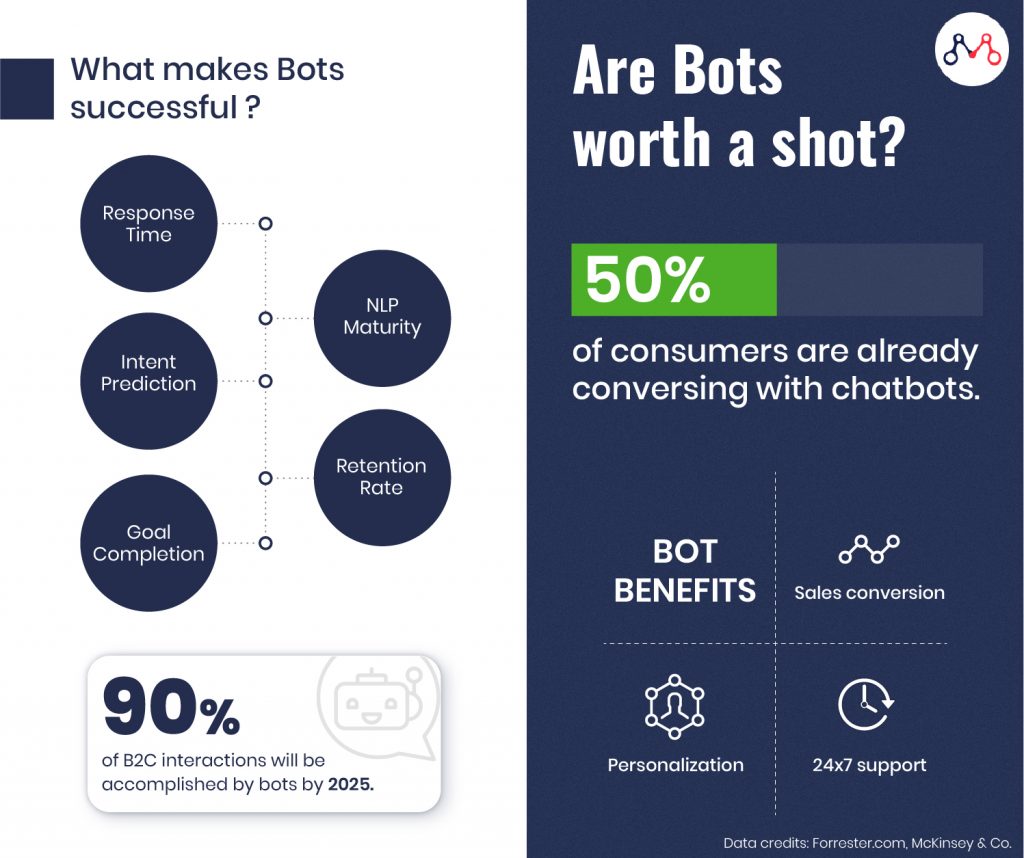
It is the average maturity level of Natural Language Processing capability of bots, measured by the way bot interacts. Initiating conversations with customers is a key focus area among organizations these days. To achieve this, bots have to be well trained in industry-specific jargon.
For instance, if a retail customer has a question about a brand’s return policy, the bot should be able to meaningfully understand the user’s query and provide relevant information as it relates to that specific question, as opposed to an information dump or worse yet failing to understand the query itself. If a bot is unable to process the user input, it contributes to ‘miss-messages’. Such instances occur when the user inputs query in a regional or idiomatic language.
It is the average time taken for the chatbot to respond to customer queries, based on the total number of messages sent by a chatbot during an interaction. Typically this can average around 5-6 seconds. However, research indicates that users will leave a site if key elements take more than 3 seconds to load.
It is the ability of the bot to anticipate what a customer wants in real-time. To achieve this, the bot must be paired with multiple sources of data and AI capable — in order to combine user behaviour, transactions, and profile details. Using this, the bot can determine intent based on both aggregated interactions for known and unknown users, and personalized data pulled from back-end systems.
It defines the number of users who willingly return to using the chatbot to address their issues. The retention rate varies according to industries. However, the clear formula for increasing user retention is to equip chatbots with the ability to understand user queries and empathically respond to them. This metric is directly correlated with the ability to personalize sales and/or customer service greetings, in 1:1 messaging.
The number of times a chatbot can resolve the query, manage ticket, generates leads, or results in conversion determines its goal completion rate. However, like humans, bots, at times, might not be handle queries on their own. Such instances account for the fall-back rate of the bots.
Here’s an insightful read on why businesses should consider chatbots.
Providing 24×7 support is not impossible for any organization. But, the labour cost associated is high, which makes chatbots a viable solution for instant customer support. IBM reports that globally businesses spend over $1.3 trillion/year to handle roughly 265 billion customer calls.
The following are examples of chatbots adoption for cost savings.
ManyChat provides bot platform on Facebook Messenger for marketing, e-commerce, and support. DigitalMarketer incorporated ManyChat’s bot for messenger marketing and have reported very high returns on their ad spend (nearly 500% ROI).
Religare has incorporated chatbot on its website and WhatsApp to handle customer queries. It has resulted in 10 times more customer interaction and 5 times more sales conversion.
Here are more insurance chatbot use cases.
1-800-Flowers is using IBM Watson’s Gwyn smart virtual shopping assistant. It interacts with customers to understand their gift preferences and accordingly help them select a personalized gift for their loved ones. More than 70% of 1-800-Flowers customers are happily ordering through Gwyn bot.
Here’s a sample Chatbot ROI calculation from a financial perspective.
CNBC reports, currently businesses are saving $20 million per year globally through chatbot adoption. By 2022, chatbots can cut operational costs by more than $8 billion per year. Also, researchers predict that by 2025, bots will accomplish about 90% of the B2C interactions. Looking at the reduction in cost and ease of operation, investing in chatbots is worth it.
We specialize in building NLP and AI-powered chatbots for enterprises. Drop us a line at hello@mantralabsglobal.com to know more.
Knowledge thats worth delivered in your inbox
Smart Manufacturing starts with real-time visibility.
Manufacturing companies today generate data by the second through sensors, machines, ERP systems, and MES platforms. But without real-time insights, even the most advanced production lines are essentially flying blind.
Manufacturers are implementing real-time dashboards that serve as control towers for their daily operations, enabling them to shift from reactive to proactive decision-making. These tools are essential to the evolution of Smart Manufacturing, where connected systems, automation, and intelligent analytics come together to drive measurable impact.
Data is available, but what’s missing is timely action.
For many plant leaders and COOs, one challenge persists: operational data is dispersed throughout systems, delayed, or hidden in spreadsheets. And this delay turns into a liability.
Real-time dashboards help uncover critical answers:
By converting raw inputs into real-time manufacturing analytics, dashboards make operational intelligence accessible to operators, supervisors, and leadership alike, enabling teams to anticipate problems rather than react to them.
Line performance and downtime trends
Track OEE in real time and identify underperforming lines.
Predictive maintenance alerts
Utilize historical and sensor data to identify potential part failures in advance.
Inventory heat maps & reorder thresholds
Anticipate stockouts or overstocks based on dynamic reorder points.
Quality metrics linked to operator actions
Isolate shifts or procedures correlated with spikes in defects or rework.
These insights allow production teams to drive day-to-day operations in line with Smart Manufacturing principles.
Role-based dashboards
Dashboards can be configured for machine operators, shift supervisors, and plant managers, each with a tailored view of KPIs.
Embedded alerts and nudges
Real-time prompts, like “Line 4 below efficiency threshold for 15+ minutes,” reduce response times and minimize disruptions.
Cross-functional drill-downs
Teams can identify root causes more quickly because users can move from plant-wide overviews to detailed machine-level data in seconds.
Data lakehouse integration
Unified access to ERP, MES, IoT sensor, and QA systems—ensuring reliable and timely manufacturing analytics.
ETL pipelines
Real-time data ingestion from high-frequency sources with minimal latency.
Visualization tools
Custom builds using Power BI, or customized solutions designed for frontline usability and operational impact.
Mantra Labs partnered with a North American die-casting manufacturer to unify its operational data into a real-time dashboard. Fragmented data, manual reporting, delayed pricing decisions, and inconsistent data quality hindered operational efficiency and strategic decision-making.
As this case shows, real-time dashboards are not just operational tools—they’re strategic enablers.
(Learn More: Powering the Future of Metal Manufacturing with Data Engineering)
| Aspect | What You Should Know |
| 1. Why Static Reports Fall Short | Delayed insights after issues occur Disconnected systems (ERP, MES, sensors) No real-time alerts or embedded decision logic |
| 2. What Real-Time Dashboards Enable | Track OEE and downtime in real-time Predictive maintenance using sensor data Dynamic inventory heat maps Quality linked to operators |
| 3. Dashboards That Drive Action | Role-based views (operator to CEO) Embedded alerts like “Line 4 down for 15+ mins” Drilldowns from plant-level to machine-level |
| 4. What Powers These Dashboards | Unified Data Lakehouse (ERP + IoT + MES) Real-time ETL pipelines Power BI or custom dashboards built for frontline usability |
Smart Manufacturing dashboards aren’t just analytics tools—they’re productivity engines. Dashboards that deliver real-time insight empower frontline teams to make faster, better decisions—whether it’s adjusting production schedules, triggering preventive maintenance, or responding to inventory fluctuations.
Explore how Mantra Labs can help you unlock operations intelligence that’s actually usable.
Knowledge thats worth delivered in your inbox


Our Sales Team will be in touch with you shortly.

Hello Stranger! Please fill in a few details,and you’ll receive a link to this case study.
 We have mailed you this case study.
Thanks for subscribing.
