


Published on Jun 14, 2024
Updated on Jun 27, 2024
Create superior customer experiences to enhance competitive advantage.
Go from zero to breakthrough with scalable, future-proof solutions.
Harness deep tech for smarter solutions and maximum impact.
Accelerate value delivery with powerful pre-built digital tools.
Help businesses connect with an internet first generation.
Test the smarter way: where precision meets efficiency.
Unlock real-time and personalized customer journeys for mobile first generation.
Turn data into decisive action with scalable AI infrastructure.
Design agile digital foundations that scale with tomorrow's business needs.
Build new-age architecture for maximum efficiency and hyper-growth.
Fine-tune your cloud infrastructure for peak performance.
Automated compliance and control for global regulations.

All
Customer Experience
Mantra
Application Development
Insurtech
Digital Health
Insurance
Deep-Tech
AgriTech(1)
Augmented Reality(21)
Clean Tech(9)
Customer Journey(17)
Design(45)
Solar Industry(8)
User Experience(68)
Edtech(10)
Events(34)
HR Tech(3)
Interviews(10)
Life@mantra(11)
Logistics(6)
Manufacturing(5)
Strategy(18)
Testing(9)
Android(48)
Backend(32)
Dev Ops(11)
Enterprise Solution(33)
Technology Modernization(9)
Frontend(29)
iOS(43)
Javascript(15)
AI in Insurance(41)
Insurtech(67)
Product Innovation(59)
Solutions(22)
E-health(12)
HealthTech(25)
mHealth(5)
Telehealth Care(4)
Telemedicine(5)
Artificial Intelligence(154)
Bitcoin(8)
Blockchain(19)
Cognitive Computing(8)
Computer Vision(8)
Data Science(24)
FinTech(51)
Banking(7)
Intelligent Automation(27)
Machine Learning(48)
Natural Language Processing(14)
Have you ever felt frustrated fetching data from an API and ending up with a bunch of information you don’t need? Enter GraphQL, a game-changer in the world of server-side APIs! This blog post takes you on a journey to understand GraphQL, from its core concepts to practical development steps.
Imagine an API that caters to your specific needs. With GraphQL, that’s exactly what you get! It’s a querying language specifically designed for server-side applications. There will be a single API endpoint. Users can request the required details and the system will send a response as per the requests with a precise answer.
Everything in GraphQL revolves around three key concepts: Schema, Queries, and Mutations.
Schema: Think of the schema as the blueprint for your data. It defines the main structure of the data that can be queried or modified, ensuring consistency and clarity for developers. The schema structure is created using fields and types.
Queries: These are used to fetch the data from the GraphQL API. You define the specific data you need in a structured format, and GraphQL gets it for you efficiently. This is a similar use case like a “GET” request in RESTful APIs.
Mutations: Need to insert, update, or delete data? Mutations are your answer. They are used to modify (Insert, Update, Delete) the data in the GraphQL API. This is a similar use case like “POST, PUT, PATCH, or DELETE” requests in RESTful APIs.
Architecture plays a crucial role in achieving efficiency. But what exactly goes on behind the scenes? Let’s break it down!
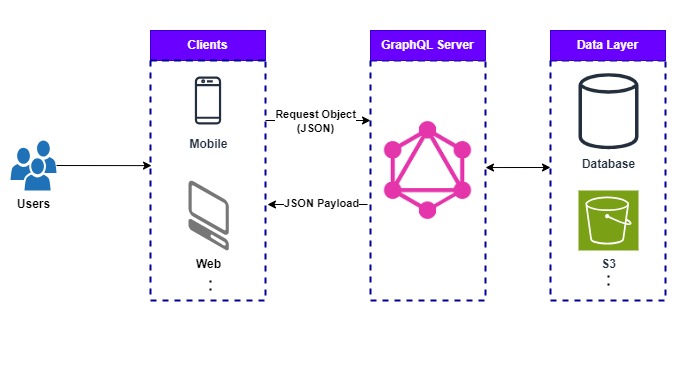
The above diagram represents the 3-tier architecture diagram of GraphQL. Here’s what’s happening:
GraphiQL is a graphical interface specifically designed for GraphQL. It allows you to build, test, and debug your queries and mutations in a user-friendly environment.
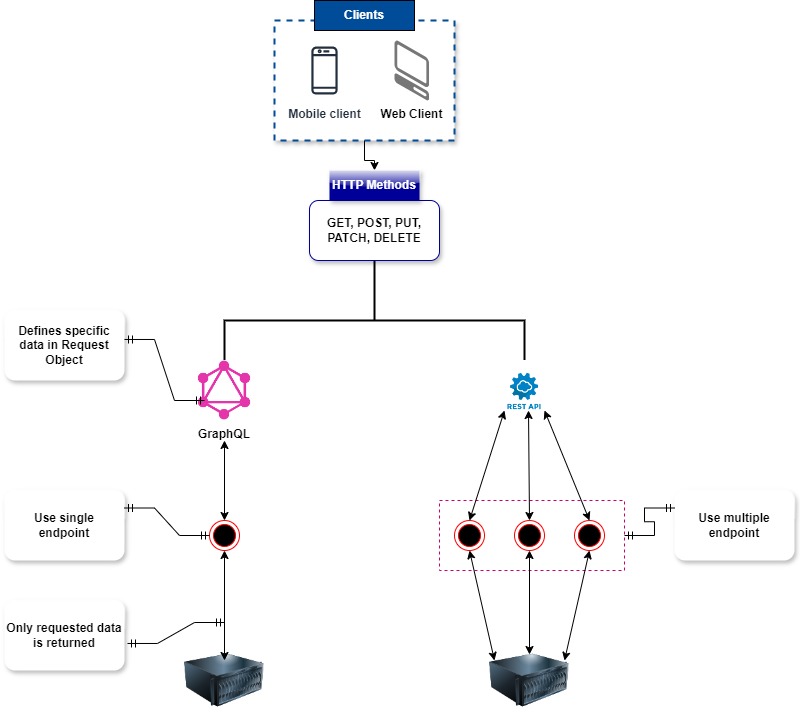
In a traditional REST API, you might need to use multiple endpoints for different requests.
With GraphQL, a single request with a well-defined structure retrieves all the data in one go, saving time and resources.
If you are considering the technology and framework to build a web application using GraphQL, you can choose Express.js.
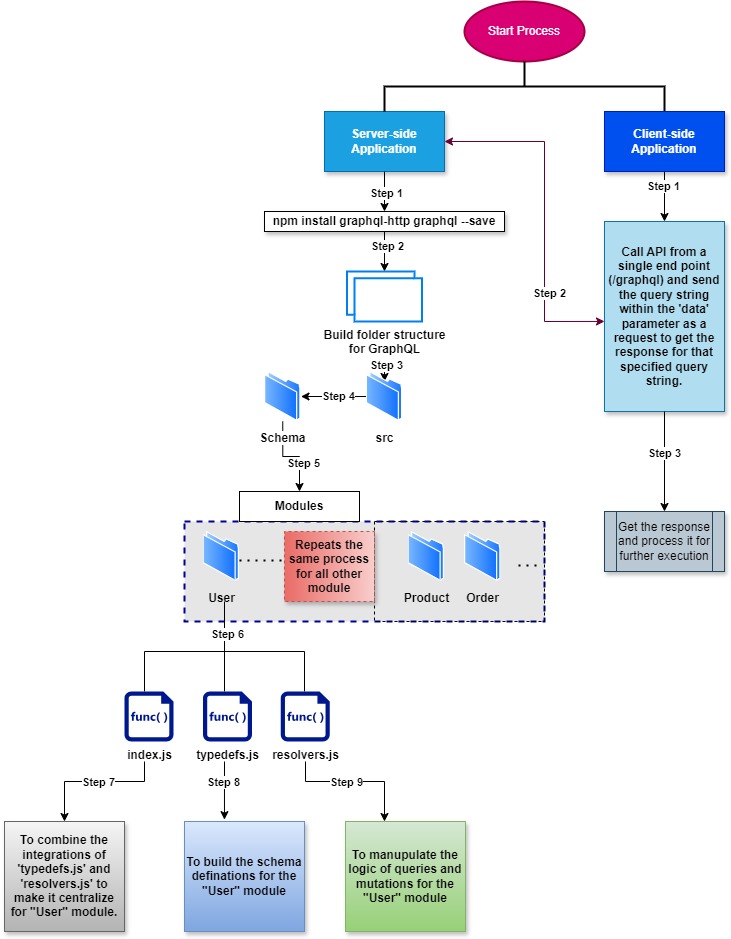
The above diagram shows the flows that give you an overall idea to develop a project using GraphQL. If you are a beginner, please check the following link.
Once your server-side is set up, it’s time to connect your application:
GraphQL is a powerful tool that simplifies API development. By offering a more efficient and flexible approach to data retrieval, it empowers developers to build cleaner, faster, and future-proof applications.
Whether you’re a seasoned developer or just starting your journey, GraphQL is worth exploring. Its clear structure, streamlined data fetching, and ever-growing community make it a valuable asset for your development toolbox.
Additional Resources:
Folder Structure and Integration Reference: you can check the following link.
Video Reference on Integrations, you can check the following link.
About the Author:
Sudipta Mal is a Technical Architect at Mantra Labs. His passion goes beyond his technical expertise; he’s also fascinated by experimenting with new technologies, which further fuels his creativity and problem-solving abilities.
Further Readings: Beego is Backend Developers’ Fav for 2024; but why?
Knowledge thats worth delivered in your inbox
Smart Manufacturing starts with real-time visibility.
Manufacturing companies today generate data by the second through sensors, machines, ERP systems, and MES platforms. But without real-time insights, even the most advanced production lines are essentially flying blind.
Manufacturers are implementing real-time dashboards that serve as control towers for their daily operations, enabling them to shift from reactive to proactive decision-making. These tools are essential to the evolution of Smart Manufacturing, where connected systems, automation, and intelligent analytics come together to drive measurable impact.
Data is available, but what’s missing is timely action.
For many plant leaders and COOs, one challenge persists: operational data is dispersed throughout systems, delayed, or hidden in spreadsheets. And this delay turns into a liability.
Real-time dashboards help uncover critical answers:
By converting raw inputs into real-time manufacturing analytics, dashboards make operational intelligence accessible to operators, supervisors, and leadership alike, enabling teams to anticipate problems rather than react to them.
Line performance and downtime trends
Track OEE in real time and identify underperforming lines.
Predictive maintenance alerts
Utilize historical and sensor data to identify potential part failures in advance.
Inventory heat maps & reorder thresholds
Anticipate stockouts or overstocks based on dynamic reorder points.
Quality metrics linked to operator actions
Isolate shifts or procedures correlated with spikes in defects or rework.
These insights allow production teams to drive day-to-day operations in line with Smart Manufacturing principles.
Role-based dashboards
Dashboards can be configured for machine operators, shift supervisors, and plant managers, each with a tailored view of KPIs.
Embedded alerts and nudges
Real-time prompts, like “Line 4 below efficiency threshold for 15+ minutes,” reduce response times and minimize disruptions.
Cross-functional drill-downs
Teams can identify root causes more quickly because users can move from plant-wide overviews to detailed machine-level data in seconds.
Data lakehouse integration
Unified access to ERP, MES, IoT sensor, and QA systems—ensuring reliable and timely manufacturing analytics.
ETL pipelines
Real-time data ingestion from high-frequency sources with minimal latency.
Visualization tools
Custom builds using Power BI, or customized solutions designed for frontline usability and operational impact.
Mantra Labs partnered with a North American die-casting manufacturer to unify its operational data into a real-time dashboard. Fragmented data, manual reporting, delayed pricing decisions, and inconsistent data quality hindered operational efficiency and strategic decision-making.
As this case shows, real-time dashboards are not just operational tools—they’re strategic enablers.
(Learn More: Powering the Future of Metal Manufacturing with Data Engineering)
| Aspect | What You Should Know |
| 1. Why Static Reports Fall Short | Delayed insights after issues occur Disconnected systems (ERP, MES, sensors) No real-time alerts or embedded decision logic |
| 2. What Real-Time Dashboards Enable | Track OEE and downtime in real-time Predictive maintenance using sensor data Dynamic inventory heat maps Quality linked to operators |
| 3. Dashboards That Drive Action | Role-based views (operator to CEO) Embedded alerts like “Line 4 down for 15+ mins” Drilldowns from plant-level to machine-level |
| 4. What Powers These Dashboards | Unified Data Lakehouse (ERP + IoT + MES) Real-time ETL pipelines Power BI or custom dashboards built for frontline usability |
Smart Manufacturing dashboards aren’t just analytics tools—they’re productivity engines. Dashboards that deliver real-time insight empower frontline teams to make faster, better decisions—whether it’s adjusting production schedules, triggering preventive maintenance, or responding to inventory fluctuations.
Explore how Mantra Labs can help you unlock operations intelligence that’s actually usable.
Knowledge thats worth delivered in your inbox


Our Sales Team will be in touch with you shortly.

Hello Stranger! Please fill in a few details,and you’ll receive a link to this case study.
 We have mailed you this case study.
Thanks for subscribing.
