


3 minutes, 25 seconds read
Published on Oct 23, 2019
Updated on May 18, 2020
Create superior customer experiences to enhance competitive advantage.
Go from zero to breakthrough with scalable, future-proof solutions.
Harness deep tech for smarter solutions and maximum impact.
Accelerate value delivery with powerful pre-built digital tools.
Help businesses connect with an internet first generation.
Test the smarter way: where precision meets efficiency.
Unlock real-time and personalized customer journeys for mobile first generation.
Turn data into decisive action with scalable AI infrastructure.
Design agile digital foundations that scale with tomorrow's business needs.
Build new-age architecture for maximum efficiency and hyper-growth.
Fine-tune your cloud infrastructure for peak performance.
Automated compliance and control for global regulations.

All
Customer Experience
Mantra
Application Development
Insurtech
Digital Health
Insurance
Deep-Tech
AgriTech(1)
Augmented Reality(21)
Clean Tech(9)
Customer Journey(17)
Design(45)
Solar Industry(8)
User Experience(68)
Edtech(10)
Events(34)
HR Tech(3)
Interviews(10)
Life@mantra(11)
Logistics(6)
Manufacturing(5)
Strategy(18)
Testing(9)
Android(48)
Backend(32)
Dev Ops(11)
Enterprise Solution(33)
Technology Modernization(9)
Frontend(29)
iOS(43)
Javascript(15)
AI in Insurance(41)
Insurtech(67)
Product Innovation(59)
Solutions(22)
E-health(12)
HealthTech(25)
mHealth(5)
Telehealth Care(4)
Telemedicine(5)
Artificial Intelligence(154)
Bitcoin(8)
Blockchain(19)
Cognitive Computing(8)
Computer Vision(8)
Data Science(24)
FinTech(51)
Banking(7)
Intelligent Automation(27)
Machine Learning(48)
Natural Language Processing(14)
With the relentless treadmill of disruption, the potential of media and entertainment companies to understand their customer’s digital consumption behaviour today is greater than at any time in history.
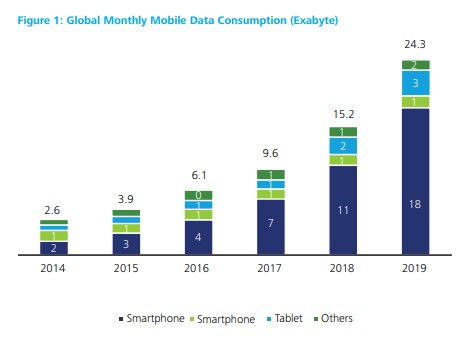
Among the digital devices, mobile devices have taken over as the preferred medium of consuming content online. The smartphone market has seen unprecedented growth in the last 5 years. Smartphone devices across the globe grew at a CAGR of 17% as compared to 9.5% growth in all mobile devices. Smartphones crossed 2 billion marks in 2014 and are expected to reach 4.6 billion by 2019.
This led to an increase in the number of devices capable of supporting digital media in tandem. Billions of screens and increasing internet access speed provided consumers with an option to access the media content of their choice anytime, anywhere.
Consumers are shifting their preferences towards digital media consumption as compared to traditional forms of media such as TV, print press, and radio. People are spending more time on digital forms of media rather than traditional mediums. This increase is mainly coming by cannibalizing traditional advertising mediums.
The increasing popularity of digital media has provided for a paradigm shift in global advertising spends. Marketers who are seeking to monetize content and capture growth are following the changing trend and increasingly allocating their budget to digital mediums. Spending on digital media as a percentage of total advertising spend has increased from 21% in 2010 to 28% in 2015 and is further expected to reach 36% by 2020.

Generation Z represents 1.8 billion people or 24% of the world population. Having an invigoratingly different attitude, Gen Z has a tremendous effect on the overall perception and digital media consumption.
They prove to be more entrepreneurial; growing up with search engines they like to discover content for themselves. They also like to be involved in the process, contribute to the solution and be more absorbed in experiences.
Though a wide range of digital consumption, the Gen Z capture insights from an array of sources. Translating these resources into viable products, services and business models will go a long way in defining the leaders of today and the leaders of tomorrow
With a population of more than 1.3 billion and around 570 million internet subscribers, India has the world’s second-highest number of internet users after China; growing at a rate of 13% annually. India to overtake the US on time spent on digital videos. The global streaming platforms are looking to capitalize on the country’s fast-growing digital content consumption. The impressive scale of the market and a liberal foreign investment environment are strategically appealing to investors.

India is among the top five markets in the world based on the number of users for online and mobile gaming; with more than 90% of millennials preferring smartphones over gaming PCs and other devices. Besides, India consumes the highest data per user in the world. In 2019, adults in India, on an average spend 29.9% of their total daily media time on digital. In a recent report, the Telecom Regulatory Authority of India estimated the digital consumption of data to be around 7.69 gigabytes per month.
India offers global investors enormous opportunities for growth. However, there also are several persistent challenges to consider before making the leap. Increasing use of digital media has accelerated video consumption, but it also has increased the piracy threat. In fact, growing piracy is likely to restrict the full monetization of content. As well as large-scale acceptance of subscription video on demand in India.
Digital advertising, a top-30 focus area of the industry, has lost as much as US$8 billion in revenues. Half of the loss incurs from “nonhuman traffic” — fake advertising impressions; that are neither generated by genuine advertisers nor received by actual consumers. The other half derives from a variety of factors such as ad-blocking and content infringements, like the sharing of passwords.
We provide innovative solutions for growth, customer engagement and streamline business processes.
Want to make the maximum of your brand?
Reach out to us at hello@mantralabsglobal.com
Knowledge thats worth delivered in your inbox
Smart Manufacturing starts with real-time visibility.
Manufacturing companies today generate data by the second through sensors, machines, ERP systems, and MES platforms. But without real-time insights, even the most advanced production lines are essentially flying blind.
Manufacturers are implementing real-time dashboards that serve as control towers for their daily operations, enabling them to shift from reactive to proactive decision-making. These tools are essential to the evolution of Smart Manufacturing, where connected systems, automation, and intelligent analytics come together to drive measurable impact.
Data is available, but what’s missing is timely action.
For many plant leaders and COOs, one challenge persists: operational data is dispersed throughout systems, delayed, or hidden in spreadsheets. And this delay turns into a liability.
Real-time dashboards help uncover critical answers:
By converting raw inputs into real-time manufacturing analytics, dashboards make operational intelligence accessible to operators, supervisors, and leadership alike, enabling teams to anticipate problems rather than react to them.
Line performance and downtime trends
Track OEE in real time and identify underperforming lines.
Predictive maintenance alerts
Utilize historical and sensor data to identify potential part failures in advance.
Inventory heat maps & reorder thresholds
Anticipate stockouts or overstocks based on dynamic reorder points.
Quality metrics linked to operator actions
Isolate shifts or procedures correlated with spikes in defects or rework.
These insights allow production teams to drive day-to-day operations in line with Smart Manufacturing principles.
Role-based dashboards
Dashboards can be configured for machine operators, shift supervisors, and plant managers, each with a tailored view of KPIs.
Embedded alerts and nudges
Real-time prompts, like “Line 4 below efficiency threshold for 15+ minutes,” reduce response times and minimize disruptions.
Cross-functional drill-downs
Teams can identify root causes more quickly because users can move from plant-wide overviews to detailed machine-level data in seconds.
Data lakehouse integration
Unified access to ERP, MES, IoT sensor, and QA systems—ensuring reliable and timely manufacturing analytics.
ETL pipelines
Real-time data ingestion from high-frequency sources with minimal latency.
Visualization tools
Custom builds using Power BI, or customized solutions designed for frontline usability and operational impact.
Mantra Labs partnered with a North American die-casting manufacturer to unify its operational data into a real-time dashboard. Fragmented data, manual reporting, delayed pricing decisions, and inconsistent data quality hindered operational efficiency and strategic decision-making.
As this case shows, real-time dashboards are not just operational tools—they’re strategic enablers.
(Learn More: Powering the Future of Metal Manufacturing with Data Engineering)
| Aspect | What You Should Know |
| 1. Why Static Reports Fall Short | Delayed insights after issues occur Disconnected systems (ERP, MES, sensors) No real-time alerts or embedded decision logic |
| 2. What Real-Time Dashboards Enable | Track OEE and downtime in real-time Predictive maintenance using sensor data Dynamic inventory heat maps Quality linked to operators |
| 3. Dashboards That Drive Action | Role-based views (operator to CEO) Embedded alerts like “Line 4 down for 15+ mins” Drilldowns from plant-level to machine-level |
| 4. What Powers These Dashboards | Unified Data Lakehouse (ERP + IoT + MES) Real-time ETL pipelines Power BI or custom dashboards built for frontline usability |
Smart Manufacturing dashboards aren’t just analytics tools—they’re productivity engines. Dashboards that deliver real-time insight empower frontline teams to make faster, better decisions—whether it’s adjusting production schedules, triggering preventive maintenance, or responding to inventory fluctuations.
Explore how Mantra Labs can help you unlock operations intelligence that’s actually usable.
Knowledge thats worth delivered in your inbox


Our Sales Team will be in touch with you shortly.

Hello Stranger! Please fill in a few details,and you’ll receive a link to this case study.
 We have mailed you this case study.
Thanks for subscribing.
