Try : Insurtech, Application Development

AgriTech(1)

Augmented Reality(21)

Clean Tech(9)

Customer Journey(17)

Design(45)

Solar Industry(8)

User Experience(68)

Edtech(10)

Events(34)

HR Tech(3)

Interviews(10)

Life@mantra(11)

Logistics(6)

Manufacturing(5)

Strategy(18)

Testing(9)

Android(48)

Backend(32)

Dev Ops(11)

Enterprise Solution(33)

Technology Modernization(9)

Frontend(29)

iOS(43)

Javascript(15)

AI in Insurance(41)

Insurtech(67)

Product Innovation(59)

Solutions(22)

E-health(12)

HealthTech(25)

mHealth(5)

Telehealth Care(4)

Telemedicine(5)

Artificial Intelligence(154)

Bitcoin(8)

Blockchain(19)

Cognitive Computing(8)

Computer Vision(8)

Data Science(24)

FinTech(51)

Banking(7)

Intelligent Automation(27)

Machine Learning(48)

Natural Language Processing(14)

expand Menu Filters

Essential UX Practices for Ed-tech

The slingshot effect of COVID-19 on distance learning contributed to the ed-tech boom in 2020–2022. Keeping an optimal user experience became crucial for ed-tech rivals to obtain a maximum user base and supply high-quality learning solutions to learners. This was due to the huge volume of tech goods on websites and apps aiming to impart education. Due to the remarkable changes in career opportunities and the need for upskilling for them, the trend of remote education is still popular and in great demand. This trend is especially evident in upskilling and test preparation. And there is increased demand to maintain a good user experience with ed-tech products. Here are some essential UX practices for Ed-tech:

  1. Accessibility:
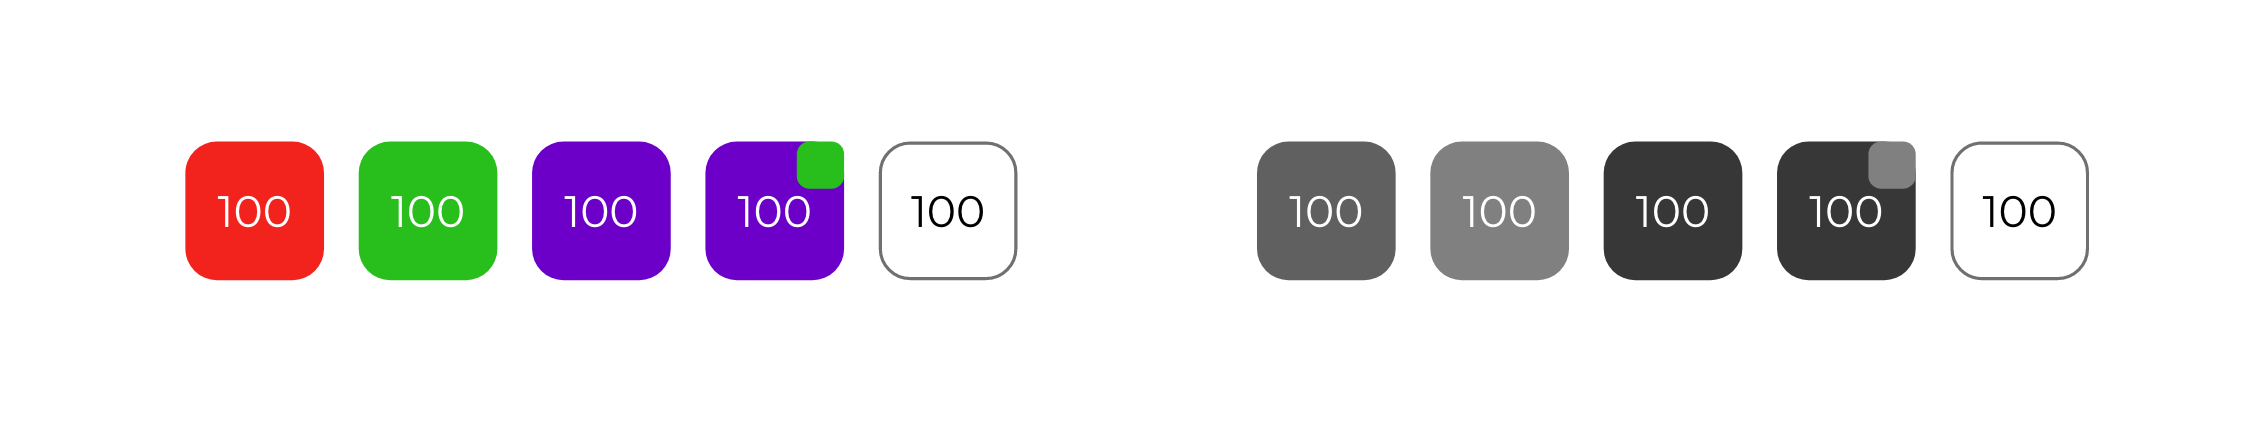
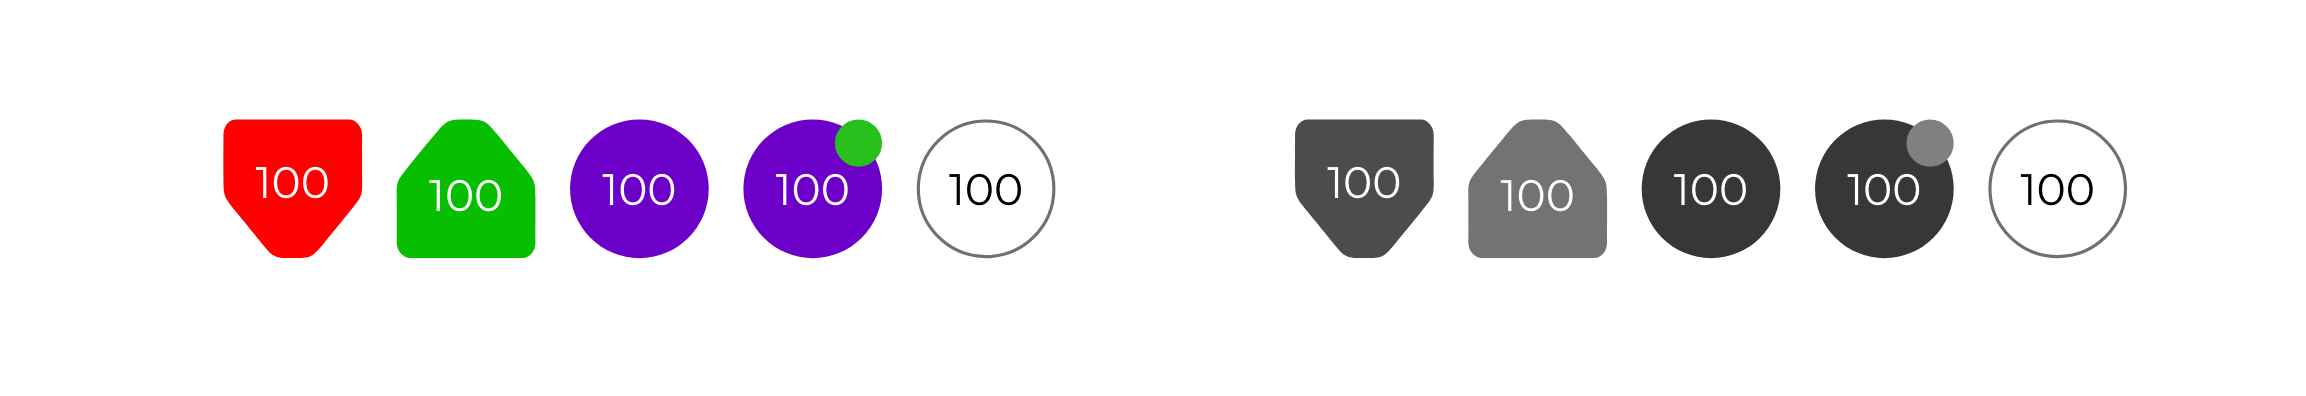
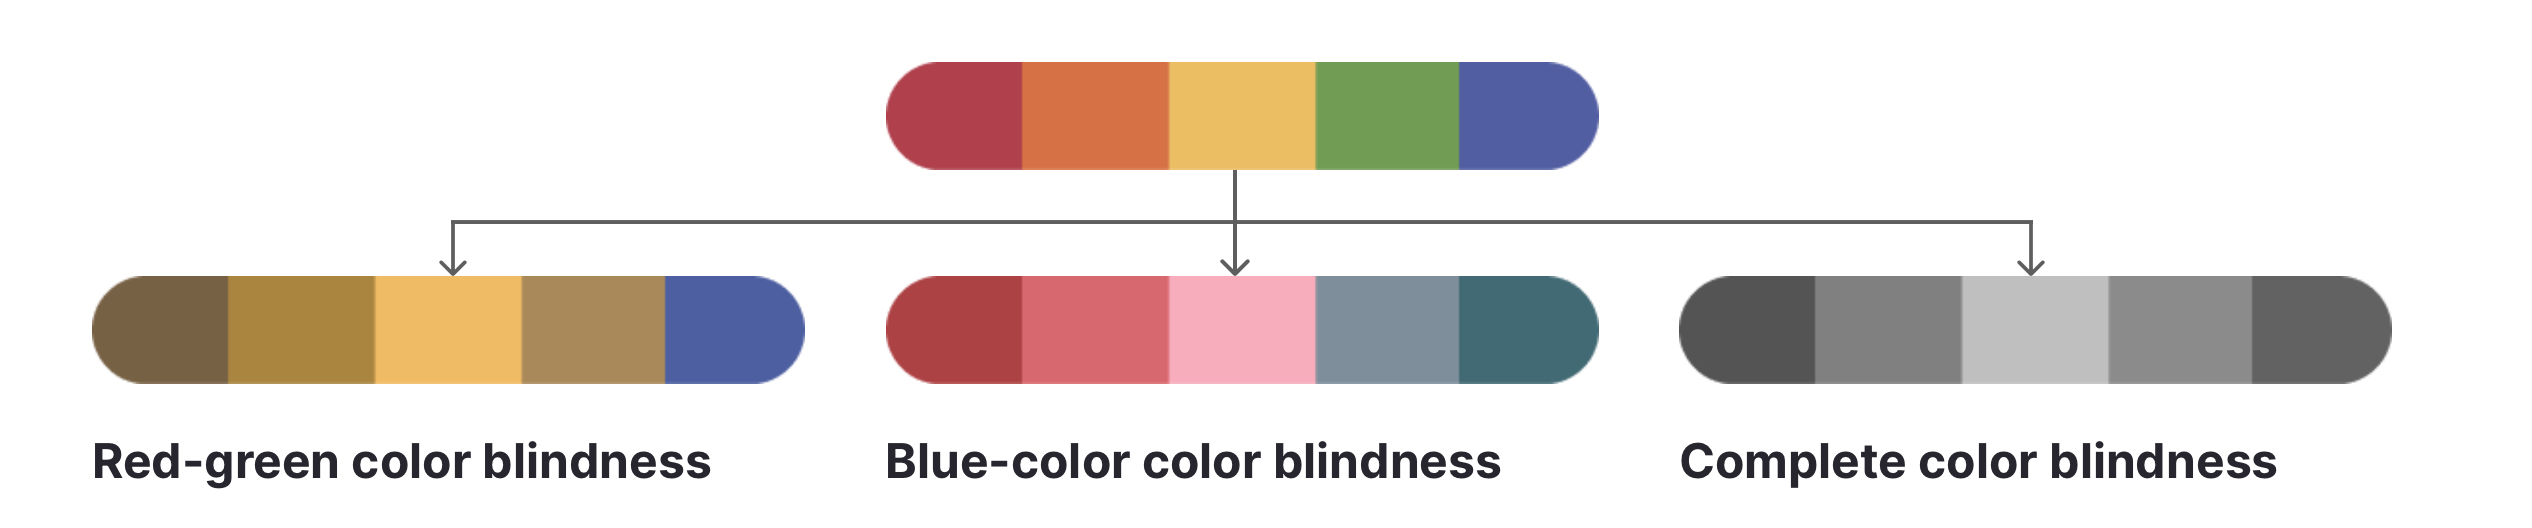
    It is crucial to make sure that all users, including those with disabilities, can access ed-tech platforms. This includes tools like text-to-speech choices, closed captioning, and screen readers. Additionally, a user-friendly interface should be included in the platform’s architecture. This makes it simple for users to explore and locate the data they require. One example below about accessibility:
Legends (for those without complete color blindness)
Legends Appearance (for those without color blindness) 
Legends (for those with complete color blindness)

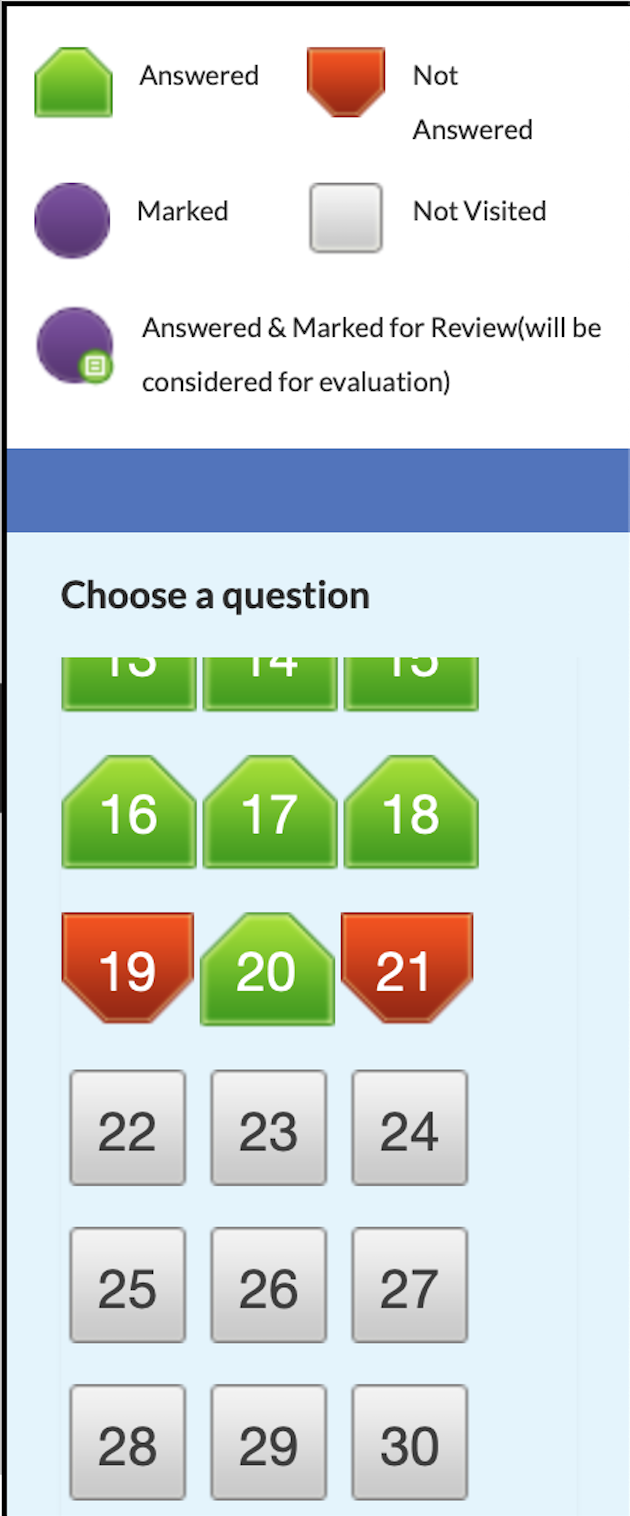
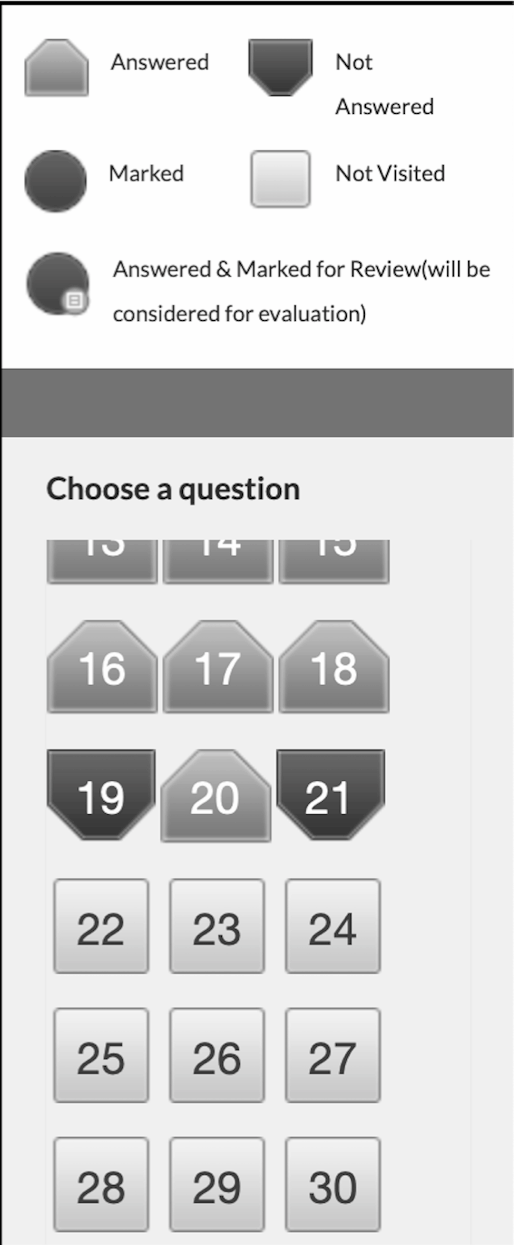
The above picture is an interface design for the nationally adopted format of the online examination. It has been designed to make the system accessible for people with color blindness (1 of every 12 people in the world is color blind). With the help of the legends, the students navigate questions with color and shape recognition. Observe the shape and color used for ‘answered’ and ‘not answered’ which are in green and red, respectively. If the shape had not been different, it would have been difficult for a student with color blindness to recognize which question is answered, which one is not, and which question is marked for review. Different shapes break the consistency in design elements as per some UI design rules, but this is necessary due to accessibility.

Legends with different shapes and colors
Legends with uniform shapes and different colors (visibility without and with colorblindness, respectively)
Legends with different shapes and colors
Legends with different shapes and different colors (visibility without and with colorblindness, respectively)
  1. Personalization:
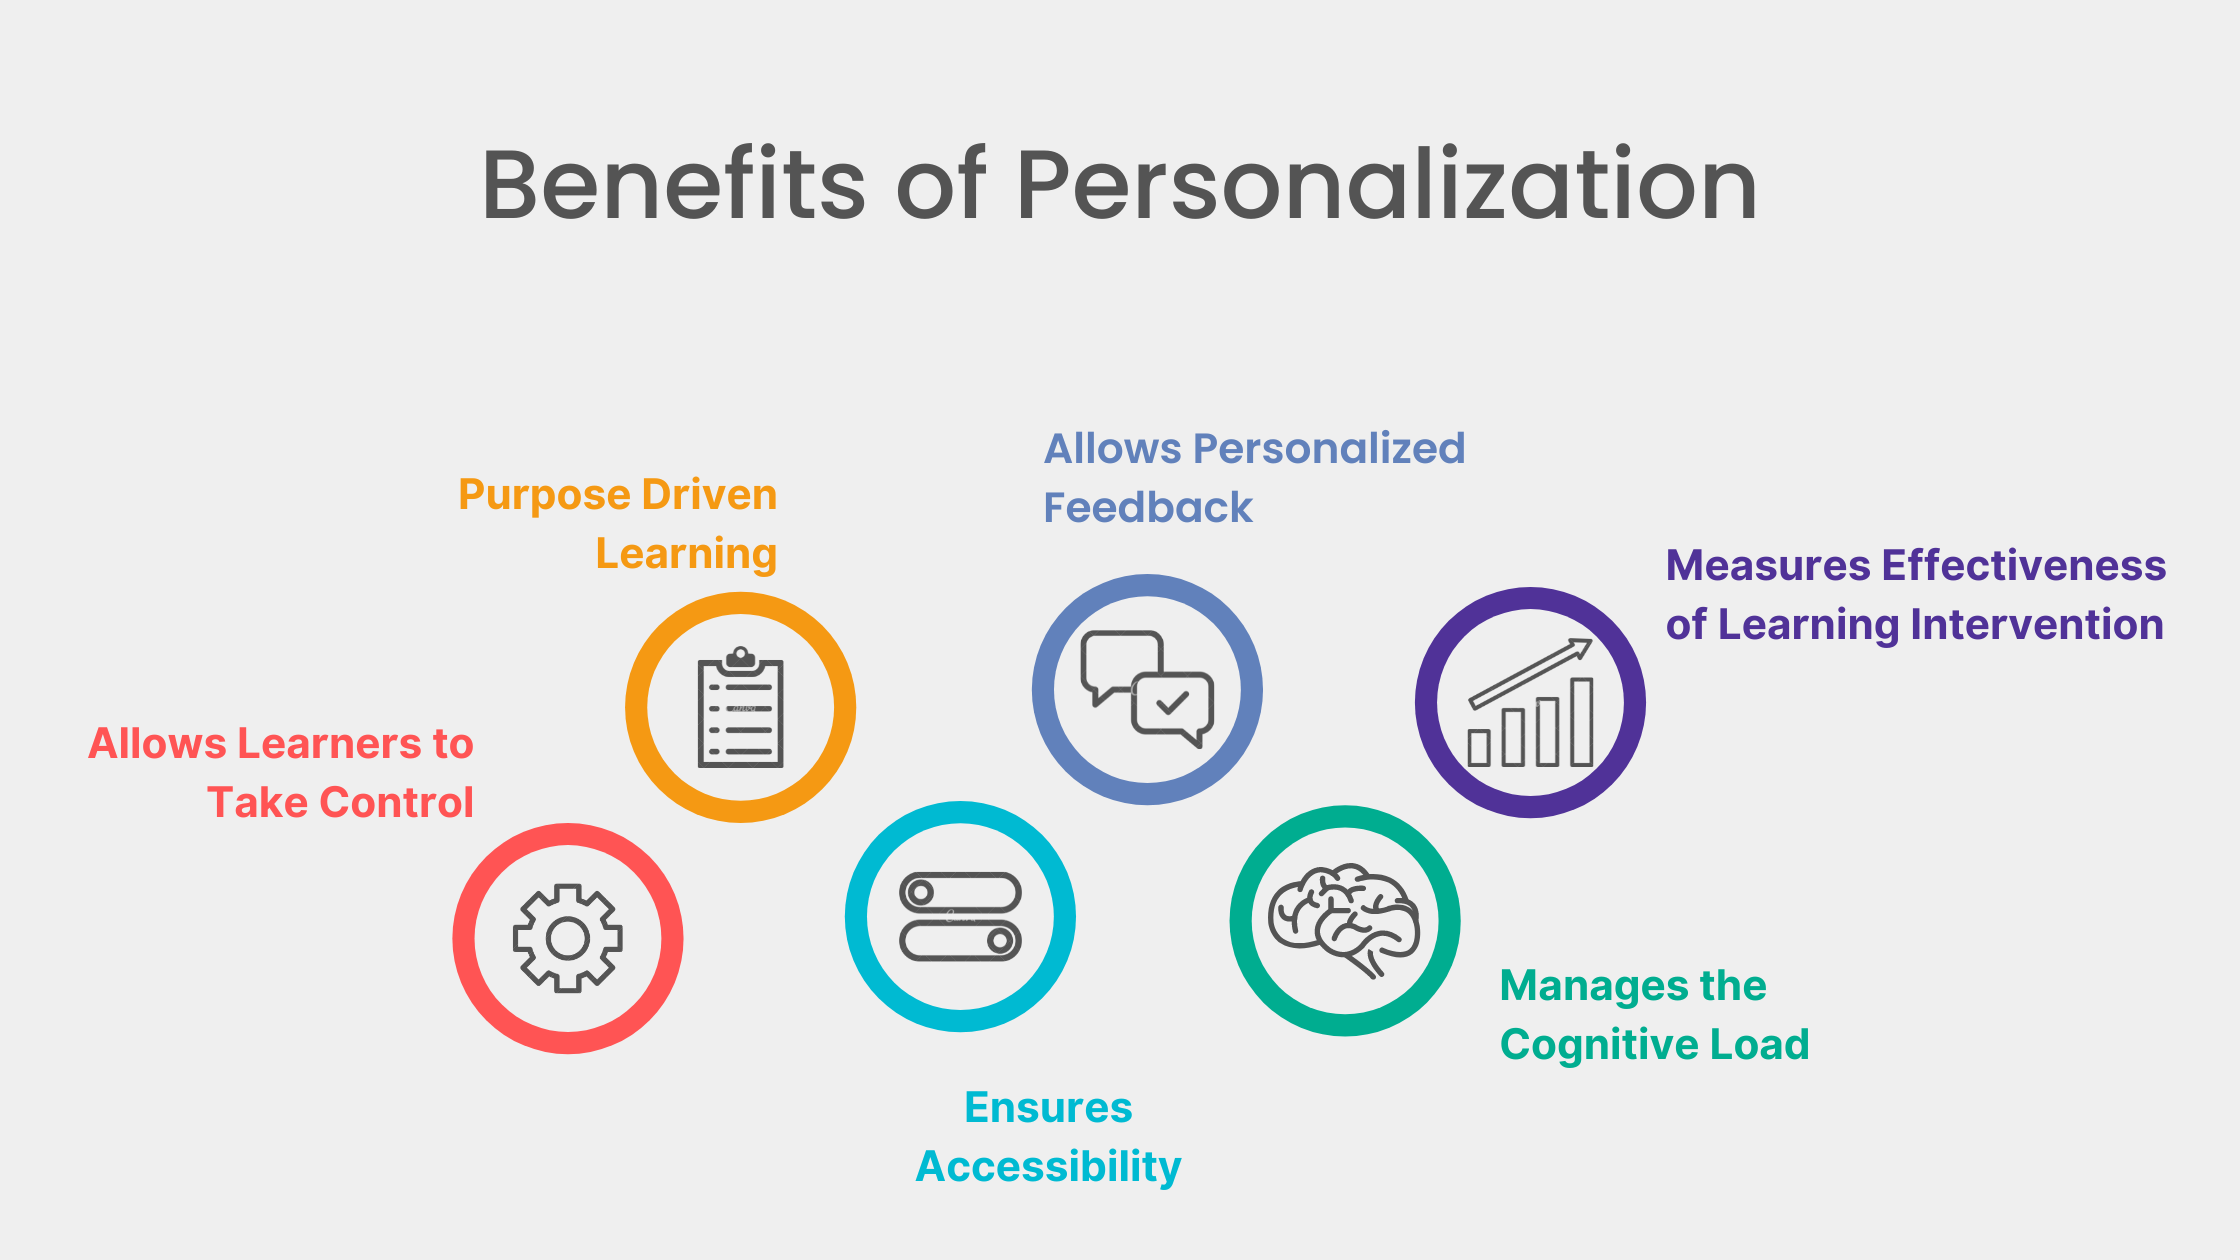
    Our learning at school was organic and nurturing due to the personal connection each student had with the teachers. When we talk about education, there should be a personal connection between the students and the system to boost students’ learning. Platforms for ed-tech should be created to meet the behavior and demands of every student. This entails tailoring feedback, designing a learning path specifically for each student, and personalizing the educational experience. This strategy boosts student enthusiasm and engagement, which will result in better learning outcomes.
  1. Gamification:
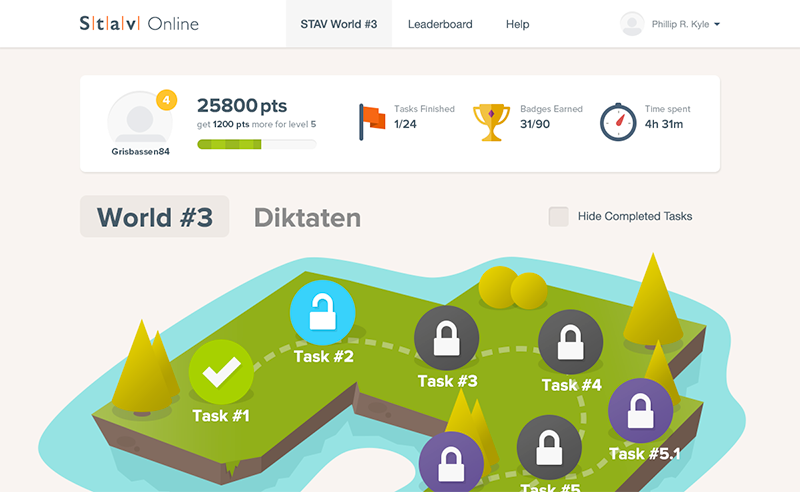
    Gamification has been one of the most important and essential UX practices in ed-tech and education. By adding game-like components like incentives, points, and badges, gamification techniques can be utilized to improve the learning experience. Learning can become more enjoyable and interesting as a result, especially for younger children.
  1. Collaboration and feedback:
    Edtech platforms should make it easier for students and teachers to collaborate, as it is a crucial component of the learning process. Features like collaborative projects, discussion boards, and video conferencing fall under this category.
    Giving feedback on time is essential for the learning process. Platforms for education technology should provide feedback on students’ progress along with suggestions for what might be done better. Students who are driven and interested in their studies may benefit from this. While building an ed-tech platform, it’s crucial to build features for smooth collaboration among learners, educators, and administration. 
  1. Mobile optimization:
    Ed-tech platforms should be mobile-optimized given the rising use of mobile devices. This entails creating an interface that is appropriate for mobile use, providing mobile-specific functionality, and making sure the platform is usable on a range of devices.
    Note: Soon an upcoming blog will have a detailed view of “mobile optimization” in ed-tech. Keep reading Mantra Labs’ blog post.
  1. Data analytics:
    Data analytics systems for ed-tech platforms should be able to monitor student progress, pinpoint areas for development, and give teachers feedback. This can assist teachers in modifying their instruction to better meet the needs of each student.
  1. Continuous improvement:
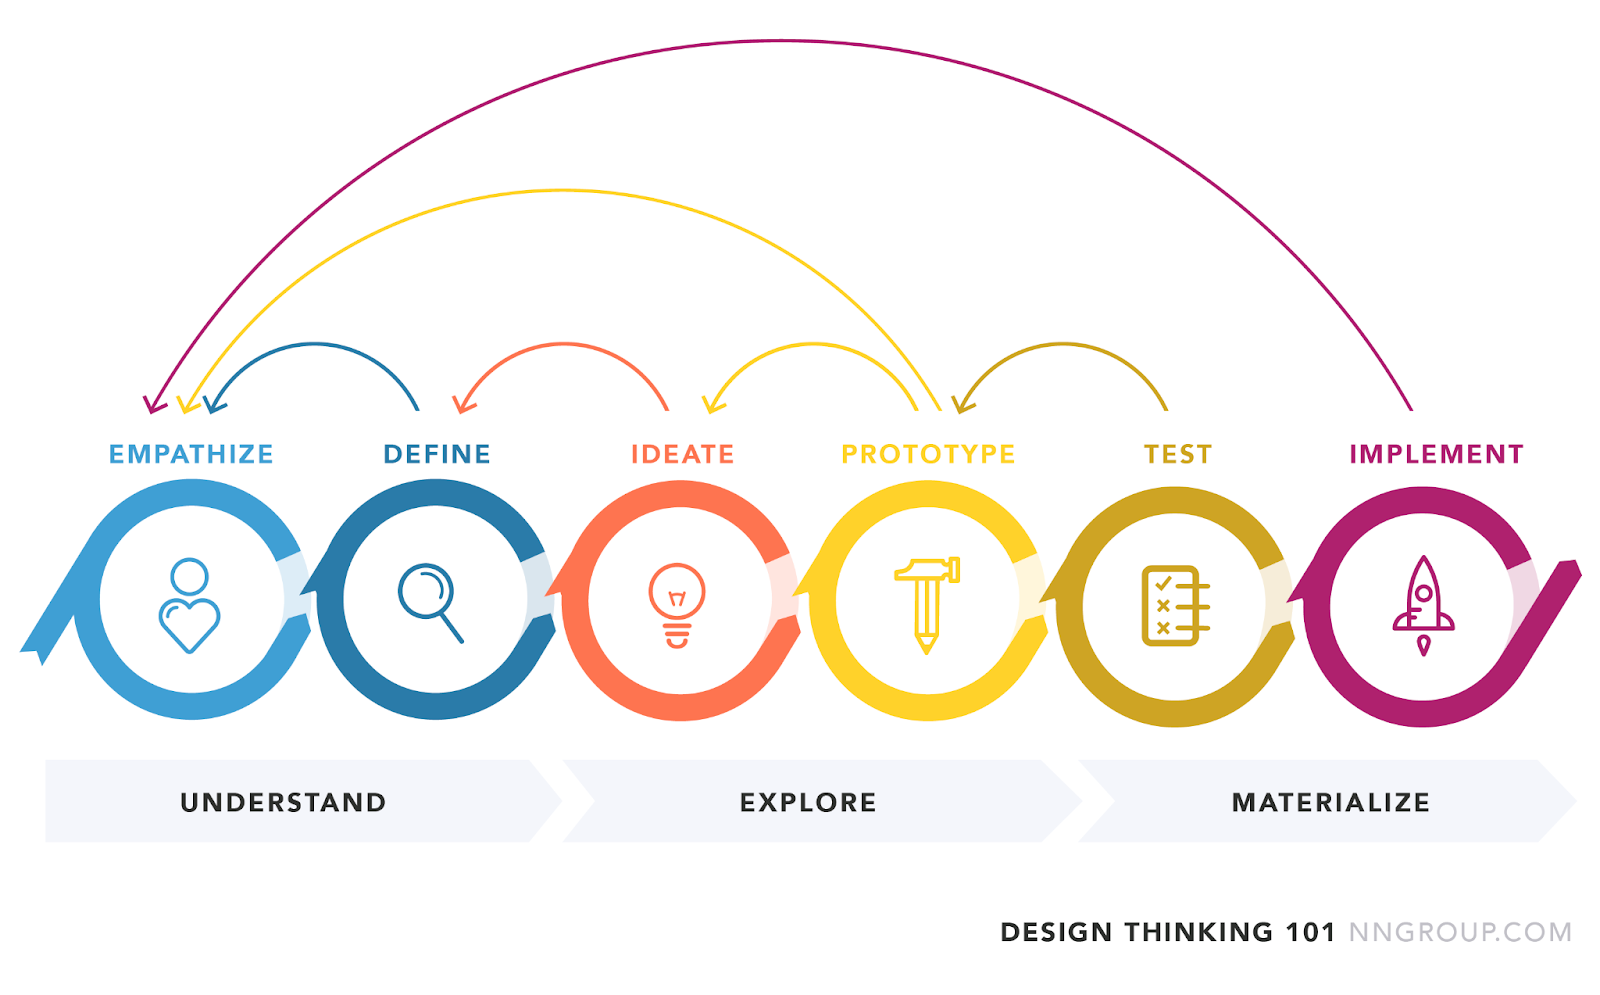
    Last but not least, ed-tech platforms must be created with ongoing improvement in mind. This includes ongoing upgrades and enhancements based on user input and the most recent developments in ed-tech. Platforms should be built with scalability in mind so that they may change and evolve as requirements do. The Design Thinking process will help in creating such a system that will help students, teachers, and the company from all angles in this situation by making, remaking, and continuously refining the system.

Key takeaways:

  1. Prioritize accessibility and personalization to create a user-friendly learning experience for all students.
  2. Personalization in design creates strong and nurturing connections between the system and students.
  3. Incorporate gamification to increase student engagement and motivation.
  4. Provide collaboration and feedback features to improve engagement in the learning process.
  5. Optimize ed-tech platforms for mobile use to cater to the growing use of mobile devices.
  6. Utilize data analytics to track student progress and identify areas for improvement.
  7. Continuously improve ed-tech platforms based on user feedback and the latest industry trends.

About the Author:

Vijendra is currently working as a Sr. UX Designer at Mantra Labs. He is passionate about UX Research and Product Design.

Cancel

Knowledge thats worth delivered in your inbox

Smart Manufacturing Dashboards: A Real-Time Guide for Data-Driven Ops

Smart Manufacturing starts with real-time visibility.

Manufacturing companies today generate data by the second through sensors, machines, ERP systems, and MES platforms. But without real-time insights, even the most advanced production lines are essentially flying blind.

Manufacturers are implementing real-time dashboards that serve as control towers for their daily operations, enabling them to shift from reactive to proactive decision-making. These tools are essential to the evolution of Smart Manufacturing, where connected systems, automation, and intelligent analytics come together to drive measurable impact.

Data is available, but what’s missing is timely action.

For many plant leaders and COOs, one challenge persists: operational data is dispersed throughout systems, delayed, or hidden in spreadsheets. And this delay turns into a liability.

Real-time dashboards help uncover critical answers:

  • What caused downtime during last night’s shift?
  • Was there a delay in maintenance response?
  • Did a specific inventory threshold trigger a quality issue?

By converting raw inputs into real-time manufacturing analytics, dashboards make operational intelligence accessible to operators, supervisors, and leadership alike, enabling teams to anticipate problems rather than react to them.

1. Why Static Reports Fall Short

  • Reports often arrive late—after downtime, delays, or defects have occurred.
  • Disconnected data across ERP, MES, and sensors limits cross-functional insights.
  • Static formats lack embedded logic for proactive decision support.

2. What Real-Time Dashboards Enable

Line performance and downtime trends
Track OEE in real time and identify underperforming lines.

Predictive maintenance alerts
Utilize historical and sensor data to identify potential part failures in advance.

Inventory heat maps & reorder thresholds
Anticipate stockouts or overstocks based on dynamic reorder points.

Quality metrics linked to operator actions
Isolate shifts or procedures correlated with spikes in defects or rework.

These insights allow production teams to drive day-to-day operations in line with Smart Manufacturing principles.

3. Dashboards That Drive Action

Role-based dashboards
Dashboards can be configured for machine operators, shift supervisors, and plant managers, each with a tailored view of KPIs.

Embedded alerts and nudges
Real-time prompts, like “Line 4 below efficiency threshold for 15+ minutes,” reduce response times and minimize disruptions.

Cross-functional drill-downs
Teams can identify root causes more quickly because users can move from plant-wide overviews to detailed machine-level data in seconds.

4. What Powers These Dashboards

Data lakehouse integration
Unified access to ERP, MES, IoT sensor, and QA systems—ensuring reliable and timely manufacturing analytics.

ETL pipelines
Real-time data ingestion from high-frequency sources with minimal latency.

Visualization tools
Custom builds using Power BI, or customized solutions designed for frontline usability and operational impact.

Smart Manufacturing in Action: Reducing Market Response Time from 48 Hours to 30 Minutes

Mantra Labs partnered with a North American die-casting manufacturer to unify its operational data into a real-time dashboard. Fragmented data, manual reporting, delayed pricing decisions, and inconsistent data quality hindered operational efficiency and strategic decision-making.

Tech Enablement:

  • Centralized Data Hub with real-time access to critical business insights.
  • Automated report generation with data ingestion and processing.
  • Accurate price modeling with real-time visibility into metal price trends, cost impacts, and customer-specific pricing scenarios. 
  • Proactive market analysis with intuitive Power BI dashboards and reports.

Business Outcomes:

  • Faster response to machine alerts
  • Quality incidents traced to specific operator workflows
  • 4X faster access to insights led to improved inventory optimization.

As this case shows, real-time dashboards are not just operational tools—they’re strategic enablers. 

(Learn More: Powering the Future of Metal Manufacturing with Data Engineering)

Key Takeaways: Smart Manufacturing Dashboards at a Glance

AspectWhat You Should Know
1. Why Static Reports Fall ShortDelayed insights after issues occur
Disconnected systems (ERP, MES, sensors)
No real-time alerts or embedded decision logic
2. What Real-Time Dashboards EnableTrack OEE and downtime in real-time
Predictive maintenance using sensor data
Dynamic inventory heat maps
Quality linked to operators
3. Dashboards That Drive ActionRole-based views (operator to CEO)
Embedded alerts like “Line 4 down for 15+ mins”
Drilldowns from plant-level to machine-level
4. What Powers These DashboardsUnified Data Lakehouse (ERP + IoT + MES)
Real-time ETL pipelines
Power BI or custom dashboards built for frontline usability

Conclusion

Smart Manufacturing dashboards aren’t just analytics tools—they’re productivity engines. Dashboards that deliver real-time insight empower frontline teams to make faster, better decisions—whether it’s adjusting production schedules, triggering preventive maintenance, or responding to inventory fluctuations.

Explore how Mantra Labs can help you unlock operations intelligence that’s actually usable.

Cancel

Knowledge thats worth delivered in your inbox

Loading More Posts ...
Go Top
ml floating chatbot