


Published on Oct 1, 2019
Updated on May 22, 2024
Create superior customer experiences to enhance competitive advantage.
Go from zero to breakthrough with scalable, future-proof solutions.
Harness deep tech for smarter solutions and maximum impact.
Accelerate value delivery with powerful pre-built digital tools.
Help businesses connect with an internet first generation.
Test the smarter way: where precision meets efficiency.
Unlock real-time and personalized customer journeys for mobile first generation.
Turn data into decisive action with scalable AI infrastructure.
Design agile digital foundations that scale with tomorrow's business needs.
Build new-age architecture for maximum efficiency and hyper-growth.
Fine-tune your cloud infrastructure for peak performance.
Automated compliance and control for global regulations.

All
Customer Experience
Mantra
Application Development
Insurtech
Digital Health
Insurance
Deep-Tech
AgriTech(1)
Augmented Reality(21)
Clean Tech(9)
Customer Journey(17)
Design(45)
Solar Industry(8)
User Experience(68)
Edtech(10)
Events(34)
HR Tech(3)
Interviews(10)
Life@mantra(11)
Logistics(6)
Manufacturing(5)
Strategy(18)
Testing(9)
Android(48)
Backend(32)
Dev Ops(11)
Enterprise Solution(33)
Technology Modernization(9)
Frontend(29)
iOS(43)
Javascript(15)
AI in Insurance(41)
Insurtech(67)
Product Innovation(59)
Solutions(22)
E-health(12)
HealthTech(25)
mHealth(5)
Telehealth Care(4)
Telemedicine(5)
Artificial Intelligence(154)
Bitcoin(8)
Blockchain(19)
Cognitive Computing(8)
Computer Vision(8)
Data Science(24)
FinTech(51)
Banking(7)
Intelligent Automation(27)
Machine Learning(48)
Natural Language Processing(14)
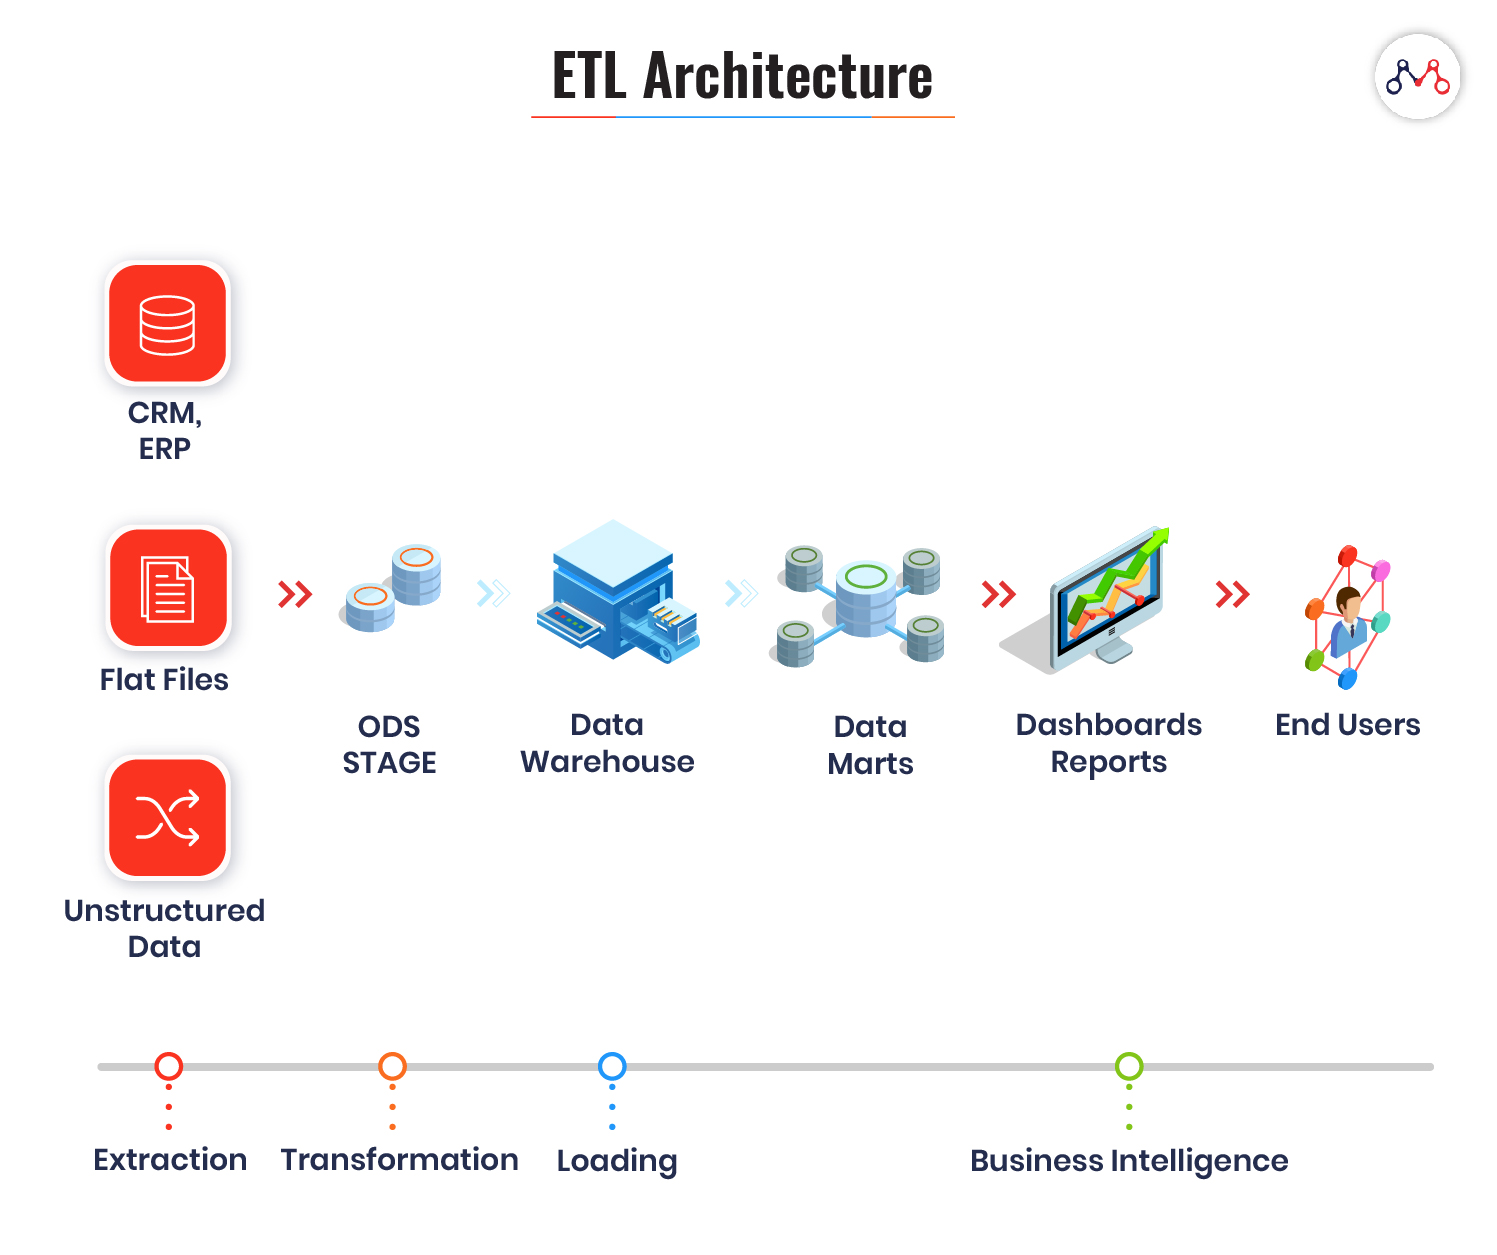
ETL (Extract, Transform, Load) is a process of extracting data from different data sources; manipulating them according to business calculations; loading the modified data into a different data warehouse. Because of the in-depth analytics data it provides, ETL function lies at the core of Business Intelligence systems. With ETL, enterprises can obtain historical, current, and predictive views of real business data. Let’s look at some ETL features that are necessary for business intelligence.
Businesses rely on the ETL process for a consolidated data view that can drive better business decisions. The following ETL features justify the point.
Leveraging data and transforming them into actionable insights is a challenge with dispersed and voluminous data. Data mapping simplifies database functionalities like integration, migration, warehousing, and transformation.
ETL allows mapping data for specific applications. Data mapping helps in establishing a correlation between different data models.
Huge volumes of data aren’t of much use in their raw form. Applying algorithms on raw data often leads to ambiguous results. It needs structuring, analyzing, and interpreting well to gain powerful insights. ETL also ensures the quality of data in the warehouse through standardization and removing duplicates.
ETL tools combine data integration and processing, making it easier to deal with voluminous data. In its data integration module, ETL assembles data from disparate sources. Post integration, it applies business rules to provide the analytics view of the data.
[Also read: Popular ETL Tools for 2020]
The modern-day ETL tools run on scripts, which are faster than traditional programming. Scripts are a lightweight set of instructions that execute specific tasks in the background. ETL also ‘batch’ processes data like moving huge volumes of data between two systems in a set schedule.
Sometimes the volume of incoming data increases to millions of events per second. To handle such situations, stream processing (monitoring and batch processing data) can help in timely decision making. For example, Banks batch process the data generally during night hours to resolves the entire day’s transactions.
Using ETL and data integration, enterprises can obtain the “best data view” across multiple sources.
ETL systems are designed to accomplish three complex database functions: extract, transform and load.
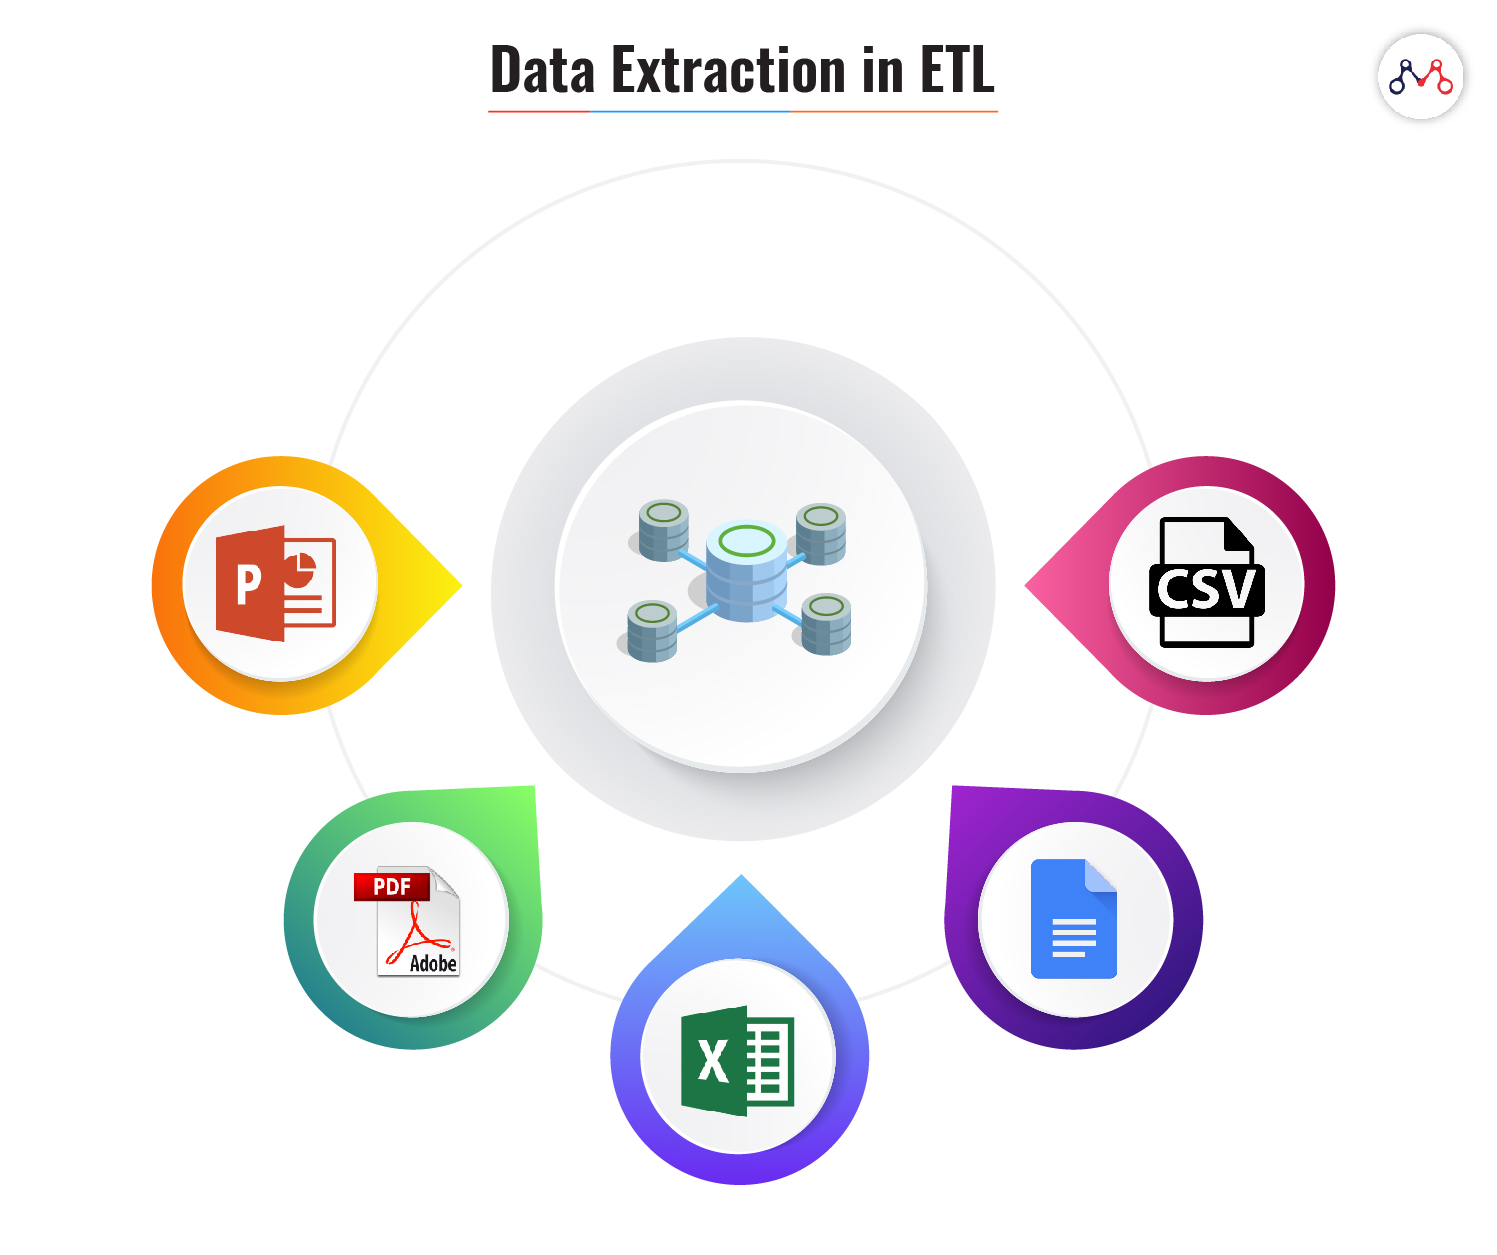
Here, a module extracts data from different data sources independent of file formats. For instance, banking and insurance technology platforms operate on different databases, hardware, operating system, and communication protocols. Also, their system derives data from a variety of touchpoints like ATMs, text files, pdfs, spreadsheets, scanned forms, etc. The extraction phase maps the data from different sources into a unified format before processing.
ETL systems ensure the following while extracting data.
This stage involves applying algorithms and modifying data according to business-specific rules. The common operations performed in ETL’s transformation stage is computation, concatenation, filters, and string operations like currency, time, data format, etc. It also validates the following-
Loading is a process of migrating structured data into the warehouse. Usually, large volumes of data need to be loaded in a short time. ETL applications play a crucial role in optimizing the load process with efficient recovery mechanisms for the instances of loading failures.
A typical ETL process involves three types of loading functions-
The ETL systems validate the following data loading parameters-
The modern-day ETL applications utilize NoSQL database systems for warehousing. NoSQL systems are suitable for big-data and real-time web-applications. NoSQL executes queries faster than traditional databases and is more memory efficient.
Transactional databases are not enough to resolve complex business queries. Also, dealing with unorganized data formats is more time-taking. ETL can help in obtaining-
Almost all industries can deploy the benefits of ETL systems. However, businesses like banking, insurance, customer relations, finance, and healthcare are the early adopters of this technology.
If your business needs intelligent data processing, we’re here to listen to your requirements. Drop us a word at hello@mantralabsglobal.com to know about our previous works on developing ETL applications.
Knowledge thats worth delivered in your inbox
Smart Manufacturing starts with real-time visibility.
Manufacturing companies today generate data by the second through sensors, machines, ERP systems, and MES platforms. But without real-time insights, even the most advanced production lines are essentially flying blind.
Manufacturers are implementing real-time dashboards that serve as control towers for their daily operations, enabling them to shift from reactive to proactive decision-making. These tools are essential to the evolution of Smart Manufacturing, where connected systems, automation, and intelligent analytics come together to drive measurable impact.
Data is available, but what’s missing is timely action.
For many plant leaders and COOs, one challenge persists: operational data is dispersed throughout systems, delayed, or hidden in spreadsheets. And this delay turns into a liability.
Real-time dashboards help uncover critical answers:
By converting raw inputs into real-time manufacturing analytics, dashboards make operational intelligence accessible to operators, supervisors, and leadership alike, enabling teams to anticipate problems rather than react to them.
Line performance and downtime trends
Track OEE in real time and identify underperforming lines.
Predictive maintenance alerts
Utilize historical and sensor data to identify potential part failures in advance.
Inventory heat maps & reorder thresholds
Anticipate stockouts or overstocks based on dynamic reorder points.
Quality metrics linked to operator actions
Isolate shifts or procedures correlated with spikes in defects or rework.
These insights allow production teams to drive day-to-day operations in line with Smart Manufacturing principles.
Role-based dashboards
Dashboards can be configured for machine operators, shift supervisors, and plant managers, each with a tailored view of KPIs.
Embedded alerts and nudges
Real-time prompts, like “Line 4 below efficiency threshold for 15+ minutes,” reduce response times and minimize disruptions.
Cross-functional drill-downs
Teams can identify root causes more quickly because users can move from plant-wide overviews to detailed machine-level data in seconds.
Data lakehouse integration
Unified access to ERP, MES, IoT sensor, and QA systems—ensuring reliable and timely manufacturing analytics.
ETL pipelines
Real-time data ingestion from high-frequency sources with minimal latency.
Visualization tools
Custom builds using Power BI, or customized solutions designed for frontline usability and operational impact.
Mantra Labs partnered with a North American die-casting manufacturer to unify its operational data into a real-time dashboard. Fragmented data, manual reporting, delayed pricing decisions, and inconsistent data quality hindered operational efficiency and strategic decision-making.
As this case shows, real-time dashboards are not just operational tools—they’re strategic enablers.
(Learn More: Powering the Future of Metal Manufacturing with Data Engineering)
| Aspect | What You Should Know |
| 1. Why Static Reports Fall Short | Delayed insights after issues occur Disconnected systems (ERP, MES, sensors) No real-time alerts or embedded decision logic |
| 2. What Real-Time Dashboards Enable | Track OEE and downtime in real-time Predictive maintenance using sensor data Dynamic inventory heat maps Quality linked to operators |
| 3. Dashboards That Drive Action | Role-based views (operator to CEO) Embedded alerts like “Line 4 down for 15+ mins” Drilldowns from plant-level to machine-level |
| 4. What Powers These Dashboards | Unified Data Lakehouse (ERP + IoT + MES) Real-time ETL pipelines Power BI or custom dashboards built for frontline usability |
Smart Manufacturing dashboards aren’t just analytics tools—they’re productivity engines. Dashboards that deliver real-time insight empower frontline teams to make faster, better decisions—whether it’s adjusting production schedules, triggering preventive maintenance, or responding to inventory fluctuations.
Explore how Mantra Labs can help you unlock operations intelligence that’s actually usable.
Knowledge thats worth delivered in your inbox


Our Sales Team will be in touch with you shortly.

Hello Stranger! Please fill in a few details,and you’ll receive a link to this case study.
 We have mailed you this case study.
Thanks for subscribing.
