


Published on May 23, 2019
Updated on Oct 16, 2019
Create superior customer experiences to enhance competitive advantage.
Go from zero to breakthrough with scalable, future-proof solutions.
Harness deep tech for smarter solutions and maximum impact.
Accelerate value delivery with powerful pre-built digital tools.
Help businesses connect with an internet first generation.
Test the smarter way: where precision meets efficiency.
Unlock real-time and personalized customer journeys for mobile first generation.
Turn data into decisive action with scalable AI infrastructure.
Design agile digital foundations that scale with tomorrow's business needs.
Build new-age architecture for maximum efficiency and hyper-growth.
Fine-tune your cloud infrastructure for peak performance.
Automated compliance and control for global regulations.

All
Customer Experience
Mantra
Application Development
Insurtech
Digital Health
Insurance
Deep-Tech
AgriTech(1)
Augmented Reality(21)
Clean Tech(9)
Customer Journey(17)
Design(45)
Solar Industry(8)
User Experience(68)
Edtech(10)
Events(34)
HR Tech(3)
Interviews(10)
Life@mantra(11)
Logistics(6)
Manufacturing(5)
Strategy(18)
Testing(9)
Android(48)
Backend(32)
Dev Ops(11)
Enterprise Solution(33)
Technology Modernization(9)
Frontend(29)
iOS(43)
Javascript(15)
AI in Insurance(41)
Insurtech(67)
Product Innovation(59)
Solutions(22)
E-health(12)
HealthTech(25)
mHealth(5)
Telehealth Care(4)
Telemedicine(5)
Artificial Intelligence(154)
Bitcoin(8)
Blockchain(19)
Cognitive Computing(8)
Computer Vision(8)
Data Science(24)
FinTech(51)
Banking(7)
Intelligent Automation(27)
Machine Learning(48)
Natural Language Processing(14)
Originally published on medium.com
If you’ve ever been in the position of having to file an insurance claim, you would agree that it isn’t the most pleasant experience that you’ve likely ever encountered.
In fact, according to J.D. Power’s 2018 Insurance Customer Satisfaction Study, managing time expectations is the key driver of satisfaction — meaning, a prompt claim settlement is still the best advertisable punch line for insurance firms. Time-to-settle satisfaction ratings were found to be 1.9 points lower even when the time frame was relatively short and insurers still missed customer timing expectations.
So what should an established insurance company do, to be at par with the customer’s desires of modern service standards? The question becomes even more pertinent when the insurance sector is still lagging behind consumer internet giants like Amazon, Uber who are creating newer levels of customer expectation. Lemonade, MetroMile and others are already taking significant market share away from traditional insurance carriers by facilitating experiences that were previously unheard of in the insurance trade.
Today, Lemonade contends that with AI, it has settled a claim in just 3 seconds! While a new era of claims settlement benchmarks are being set with AI, the industry is shifting their attitude towards embracing the real potential of intelligent technologies that can shave-off valuable time and money from the firm’s bottom-line.
How AI integrates across the Insurance Claims Life Cycle
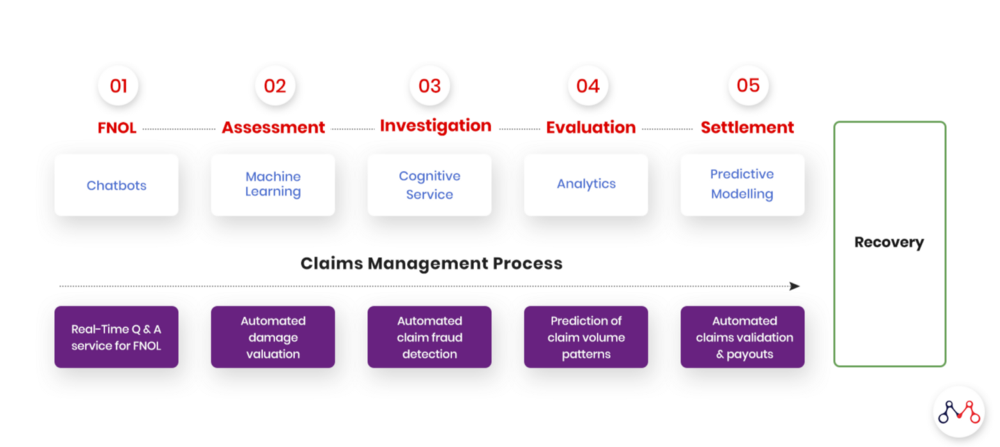
For this entire process to materialize — from the customer filling out the claim information online, to receiving the amount in a bank account within a short amount of time, and have the entire process be completely automated without any interference, bias, or the whims of human prejudice.
How does this come about? How does a system understand large volumes of information that requires subjective, human-like interpretation?
The answer lies within the cognitive abilities of AI systems.
For some insurers the thought that readily comes to mind is — Surely, it must be quite difficult to achieve this in real-world scenarios. Well, the answer is — NO, it isn’t!
Indeed, there are numerous examples of real-world cases that have already been implemented or are presently in use. To understand how these systems work, we need to break down the entire process into multiple steps, and see how each step is using AI and then passing over the control to the next step for further processing.
How It Works
For the AI-enabled health insurance claims cycle, there are a few distinct steps in the entire process.
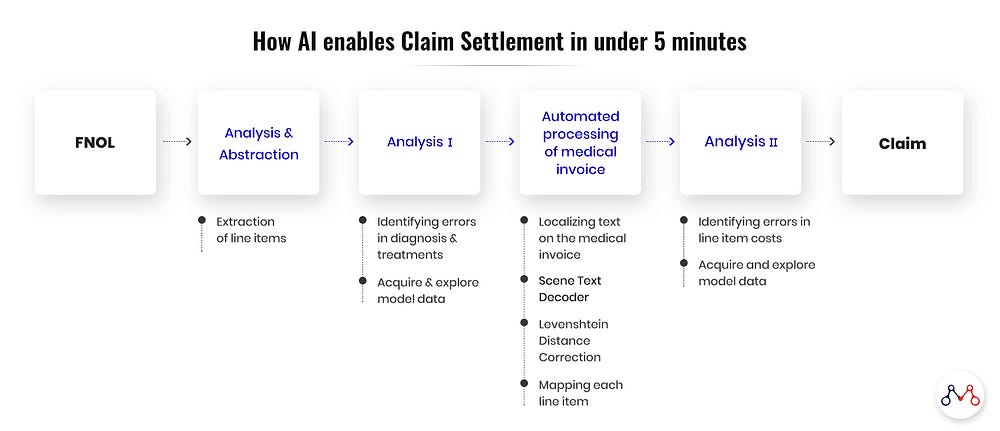
Analysis and abstraction
The following information is first extracted from medical documents (diagnosis reports, admission & discharge summaries etc.)
There are in essence two different systems. The first one (described above) processes the information that is presented to it, while the other looks from the angle of genuineness of the information. The latter is the fraud detection system (Fraud, Abuse & Wastage Analyzer) that goes into critical examination of claim documents from the fraud, abuse and wastage perspective.
Fraud, Abuse & Wastage Analyzer
Insurance companies audit about 10% of their total claims. Out of which around 4–5% are found to be illegitimate. But the problem is that the results of these audit findings are available much after the claim has been settled, following which recovering back the money already paid for unsustainable claims is not that easy.
This means that companies are losing big sums on fraudulent claims. But is there a way by which insurers can sniff out fraud in real time while the claim is under processing?
With Cognitive AI technologies available today, this is achievable. All you need is a system that analyses hundreds and thousands of combinations of symptoms, diagnoses and comes up with possible suggested treatments. The suggestions are based on the learnings from past instances of cases that has been exposed to the AI system.
The suggested treatments’ tentative cost — based on the location, hospital, etc., is compared with the actual cost of the treatment. If the difference suggests an anomaly, then the case is flagged for review.
Automated processing of medical invoices
Now if your Fraud Analyzer finds no problem with a claim, how can you expedite its processing? Processing requires gathering information from all medical invoices, categorizing them into benefit buckets, and then finalizing the amount allowed under each head. Advanced systems can automate this entire process, ruling out manual intervention in most of these cases.
Recent AI systems have the capability of extracting line items from a scanned medical invoice image. This is achieved through a multistep process, outlined below.
Each line item is iterated over and looked up against the policy limits to get its upper limit. Each line item amount is aggregated to finally get the final settlement amount.
If the final settlement amount is within the limits set for straight through processing and no flags are raised by the Fraud, Abuse & Wastage Analyzer, then the claim is sent to billing for processing.
Moving Ahead With AI Enabled Claims
Today, AI transforms the insurance claims cycle with greater accuracy, speed and productivity, at a fraction of the cost (in the long run) — while delivering enhanced decision making capabilities and a superior experience in customer service. While, in the past, these innovations were overlooked and undervalued for the impact they produced — the insurers of today need to identify the proper use cases that match their organization’s needs and the significant value they can deliver to the customers of tomorrow. The cardinal rule is to — start small through feasible pilots, that will first bring lost dividends back into the organization.
Knowledge thats worth delivered in your inbox
Smart Manufacturing starts with real-time visibility.
Manufacturing companies today generate data by the second through sensors, machines, ERP systems, and MES platforms. But without real-time insights, even the most advanced production lines are essentially flying blind.
Manufacturers are implementing real-time dashboards that serve as control towers for their daily operations, enabling them to shift from reactive to proactive decision-making. These tools are essential to the evolution of Smart Manufacturing, where connected systems, automation, and intelligent analytics come together to drive measurable impact.
Data is available, but what’s missing is timely action.
For many plant leaders and COOs, one challenge persists: operational data is dispersed throughout systems, delayed, or hidden in spreadsheets. And this delay turns into a liability.
Real-time dashboards help uncover critical answers:
By converting raw inputs into real-time manufacturing analytics, dashboards make operational intelligence accessible to operators, supervisors, and leadership alike, enabling teams to anticipate problems rather than react to them.
Line performance and downtime trends
Track OEE in real time and identify underperforming lines.
Predictive maintenance alerts
Utilize historical and sensor data to identify potential part failures in advance.
Inventory heat maps & reorder thresholds
Anticipate stockouts or overstocks based on dynamic reorder points.
Quality metrics linked to operator actions
Isolate shifts or procedures correlated with spikes in defects or rework.
These insights allow production teams to drive day-to-day operations in line with Smart Manufacturing principles.
Role-based dashboards
Dashboards can be configured for machine operators, shift supervisors, and plant managers, each with a tailored view of KPIs.
Embedded alerts and nudges
Real-time prompts, like “Line 4 below efficiency threshold for 15+ minutes,” reduce response times and minimize disruptions.
Cross-functional drill-downs
Teams can identify root causes more quickly because users can move from plant-wide overviews to detailed machine-level data in seconds.
Data lakehouse integration
Unified access to ERP, MES, IoT sensor, and QA systems—ensuring reliable and timely manufacturing analytics.
ETL pipelines
Real-time data ingestion from high-frequency sources with minimal latency.
Visualization tools
Custom builds using Power BI, or customized solutions designed for frontline usability and operational impact.
Mantra Labs partnered with a North American die-casting manufacturer to unify its operational data into a real-time dashboard. Fragmented data, manual reporting, delayed pricing decisions, and inconsistent data quality hindered operational efficiency and strategic decision-making.
As this case shows, real-time dashboards are not just operational tools—they’re strategic enablers.
(Learn More: Powering the Future of Metal Manufacturing with Data Engineering)
| Aspect | What You Should Know |
| 1. Why Static Reports Fall Short | Delayed insights after issues occur Disconnected systems (ERP, MES, sensors) No real-time alerts or embedded decision logic |
| 2. What Real-Time Dashboards Enable | Track OEE and downtime in real-time Predictive maintenance using sensor data Dynamic inventory heat maps Quality linked to operators |
| 3. Dashboards That Drive Action | Role-based views (operator to CEO) Embedded alerts like “Line 4 down for 15+ mins” Drilldowns from plant-level to machine-level |
| 4. What Powers These Dashboards | Unified Data Lakehouse (ERP + IoT + MES) Real-time ETL pipelines Power BI or custom dashboards built for frontline usability |
Smart Manufacturing dashboards aren’t just analytics tools—they’re productivity engines. Dashboards that deliver real-time insight empower frontline teams to make faster, better decisions—whether it’s adjusting production schedules, triggering preventive maintenance, or responding to inventory fluctuations.
Explore how Mantra Labs can help you unlock operations intelligence that’s actually usable.
Knowledge thats worth delivered in your inbox


Our Sales Team will be in touch with you shortly.

Hello Stranger! Please fill in a few details,and you’ll receive a link to this case study.
 We have mailed you this case study.
Thanks for subscribing.
