Try : Insurtech, Application Development

AgriTech(1)

Augmented Reality(21)

Clean Tech(9)

Customer Journey(17)

Design(45)

Solar Industry(8)

User Experience(68)

Edtech(10)

Events(34)

HR Tech(3)

Interviews(10)

Life@mantra(11)

Logistics(6)

Manufacturing(5)

Strategy(18)

Testing(9)

Android(48)

Backend(32)

Dev Ops(11)

Enterprise Solution(33)

Technology Modernization(9)

Frontend(29)

iOS(43)

Javascript(15)

AI in Insurance(41)

Insurtech(67)

Product Innovation(59)

Solutions(22)

E-health(12)

HealthTech(25)

mHealth(5)

Telehealth Care(4)

Telemedicine(5)

Artificial Intelligence(154)

Bitcoin(8)

Blockchain(19)

Cognitive Computing(8)

Computer Vision(8)

Data Science(24)

FinTech(51)

Banking(7)

Intelligent Automation(27)

Machine Learning(48)

Natural Language Processing(14)

expand Menu Filters

Surprising trends in India’s digital content consumption

4 minutes, 35 seconds read

In a country that ranks second in the world for video consumption, cheap data is often attributed as the primary driver behind it. Although data is cheapest in India (Rs. 18.5/GB in 2018, Rs. 3.4/GB in 2019), regional content curated and consumed by natives contributed a great deal to the adoption of digital in rural India. Digital content consumption is expected to double, with over a billion of the population having a smartphone by the next decade. Let’s see what will change in the coming decade? But before, a quick insight into the existing Indian digital landscape.

India’s Digital Demography

Users: 94% of the urban population in India has an internet subscription; which falls to a considerable low among the rural populace (only 24%), according to TRAI.

There are four categories of internet users – Digital sophisticates (3%): these are tech-savvy, wealthy, and urban and prefer global and original content; Digital enthusiasts (36%): these are mainly smartphone & TV streaming users with preference for Hindi and regional content; Digital mainstream (59%): these are predominantly smartphone users and seek free content available online or bundled TV packages; Fringe users (2%): these are irregular users belonging to remote areas where internet connectivity is poor. (India’s Digital Future, KPMG, 2019)
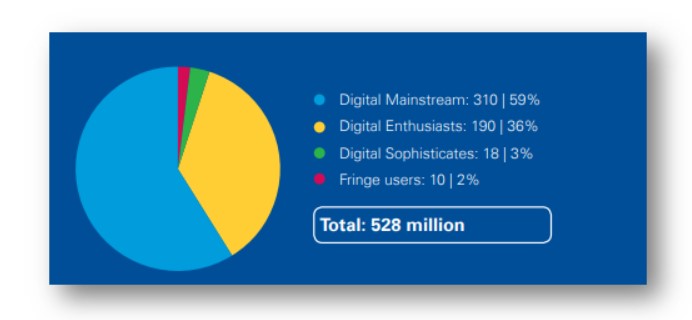
Temp-infographic

Preferences: Nearly 30% of google search in India is voice-driven (Business Standard, 2019), indicating voice assistance will further progress linguistic democratization.

In India, YouTube accounts for nearly 265 million unique, active users. 95% of these users watch videos in their regional languages (Economic Times, 2018).

Google and Facebook account for nearly 80% of the digital advertisement in India (KPMG India analysis). In 2018, Google reported INR 93 billion in revenues from its operations in India, with 67% accruing from its digital ads platform. Also, video ads contribute to most of ad-spent (53%).

In 2018, there were 340 million smartphone users in India, which is projected to reach 829 million by 2022, according to the CISCO VNI report.

New Trends in Digital Content Consumption

Today, video streaming services have more subscribers (613 million) than traditional cable connection (556 million), according to VentureBeat news.

The media consumption in India has grown at a CAGR 9% during 2012-18 (IBEF, 2019), which is almost nine times that of the US. Print media and television remains the largest platform for advertisement, however the future might witness a shift.

The Indian FMCG sector spends the most on digital advertising. However, considering its overall budget, it’s only 16%. Interestingly, the BFSI sector spends nearly 38% of its marketing budget on digital advertising. (Dentsu Aegis Digital Report, 2019) This indicates that industries have started to realize and invest in digital platforms.

Regional content: According to KPMG in India analysis, consumers spend 35-43% of their time on regional videos on digital platforms. Digital content and media platforms like Zee5, Hotstar, Voot, and Amazon Prime Video are keen on producing original and region-based content. According to Financial Express, the cost to develop regional content is 30-40% lower than that of Hindi and has a larger viewership. 

Original content: The increased digital content consumption also demands originality. Today, content generation is not limited to the media and entertainment industry. For instance, in September 2019, Zomato launched a video streaming service on its app. The primary goal remains the same- customer engagement. Addressing the fact that food is not the only thing people consume these days, businesses are penetrating the minds of youth through quality and original content. 

Hotstar reports 80% of its viewership from dramas and movies and plans to invest INR 120 crores in creating original content.

The Future of Content in India and APAC

The next significant disruption in content consumption will come from 5G technology. Because digital content needs internet and India’s still dangling between 2G and lower cap of the 4G network. Setting up a 5G network will require a $500 billion investment in the next 5-7 years. The government is expecting the initial deployment of the 5G network by 2020 and roll-out by 2022.

5G technology will be able to handle more traffic at a higher speed, satisfying the demand for high data and the growing number of mobile users. HD content will become a thing of the past and consumers will be interacting with augmented reality in their everyday life. It will not only enhance augmented reality and virtual reality experiences but will also support IoT, autonomous vehicles, and automation to name a few. However, India isn’t quite ready for 5G technology yet. The following graph illustrates the countries which are about to enter the 5G era.
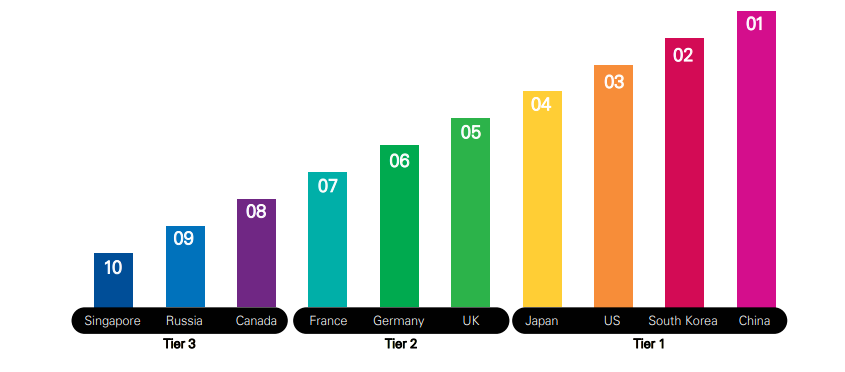
5G-Adoption-across-the-world

An overview of digital behavior in Japan, Korea, and Singapore which are among the top 10 countries to deploy 5G.

 JapanRepublic of KoreaSingapore
Internet penetration93%99.5%84.0%
Mobile penetration89.9%95.8%147.3%
Preferred device to go onlineSmartphone (59.7%)Smartphone (94.3%)
Online activityEmail (80.2%), weather report (65.8%), transport (63.4%)Communication (95.2%), information search (94.0%)

Source: SourceSource: India’s Digital Future, KPMG

5G will also make technologies like Augmented Reality, Virtual Reality, cloud-based gaming, IoT and OTT services commercially available.

Apart from this, AI (Artificial Intelligence) will continue to retain customer engagement through predictive analytics, machine learning, and natural language processing capabilities.

For example, Hotstar uses machine learning algorithms for personalized movie recommendations. It predicts user preferences by calculating total watch time per user per month. The company is leveraging AI technology for translations, audio to text conversions, video compression, object detection, and scene classification.

Also read – Your Shopping Cart just got a whole lot Smarter, this festive season.

We’re an AI-first products and solutions firm with extensive experience in insurance and consumer internet domains. Feel free to reach us out at hello@mantralabsglobal.com for an intelligent digital solution to your business requirements.

Cancel

Knowledge thats worth delivered in your inbox

Smart Manufacturing Dashboards: A Real-Time Guide for Data-Driven Ops

Smart Manufacturing starts with real-time visibility.

Manufacturing companies today generate data by the second through sensors, machines, ERP systems, and MES platforms. But without real-time insights, even the most advanced production lines are essentially flying blind.

Manufacturers are implementing real-time dashboards that serve as control towers for their daily operations, enabling them to shift from reactive to proactive decision-making. These tools are essential to the evolution of Smart Manufacturing, where connected systems, automation, and intelligent analytics come together to drive measurable impact.

Data is available, but what’s missing is timely action.

For many plant leaders and COOs, one challenge persists: operational data is dispersed throughout systems, delayed, or hidden in spreadsheets. And this delay turns into a liability.

Real-time dashboards help uncover critical answers:

  • What caused downtime during last night’s shift?
  • Was there a delay in maintenance response?
  • Did a specific inventory threshold trigger a quality issue?

By converting raw inputs into real-time manufacturing analytics, dashboards make operational intelligence accessible to operators, supervisors, and leadership alike, enabling teams to anticipate problems rather than react to them.

1. Why Static Reports Fall Short

  • Reports often arrive late—after downtime, delays, or defects have occurred.
  • Disconnected data across ERP, MES, and sensors limits cross-functional insights.
  • Static formats lack embedded logic for proactive decision support.

2. What Real-Time Dashboards Enable

Line performance and downtime trends
Track OEE in real time and identify underperforming lines.

Predictive maintenance alerts
Utilize historical and sensor data to identify potential part failures in advance.

Inventory heat maps & reorder thresholds
Anticipate stockouts or overstocks based on dynamic reorder points.

Quality metrics linked to operator actions
Isolate shifts or procedures correlated with spikes in defects or rework.

These insights allow production teams to drive day-to-day operations in line with Smart Manufacturing principles.

3. Dashboards That Drive Action

Role-based dashboards
Dashboards can be configured for machine operators, shift supervisors, and plant managers, each with a tailored view of KPIs.

Embedded alerts and nudges
Real-time prompts, like “Line 4 below efficiency threshold for 15+ minutes,” reduce response times and minimize disruptions.

Cross-functional drill-downs
Teams can identify root causes more quickly because users can move from plant-wide overviews to detailed machine-level data in seconds.

4. What Powers These Dashboards

Data lakehouse integration
Unified access to ERP, MES, IoT sensor, and QA systems—ensuring reliable and timely manufacturing analytics.

ETL pipelines
Real-time data ingestion from high-frequency sources with minimal latency.

Visualization tools
Custom builds using Power BI, or customized solutions designed for frontline usability and operational impact.

Smart Manufacturing in Action: Reducing Market Response Time from 48 Hours to 30 Minutes

Mantra Labs partnered with a North American die-casting manufacturer to unify its operational data into a real-time dashboard. Fragmented data, manual reporting, delayed pricing decisions, and inconsistent data quality hindered operational efficiency and strategic decision-making.

Tech Enablement:

  • Centralized Data Hub with real-time access to critical business insights.
  • Automated report generation with data ingestion and processing.
  • Accurate price modeling with real-time visibility into metal price trends, cost impacts, and customer-specific pricing scenarios. 
  • Proactive market analysis with intuitive Power BI dashboards and reports.

Business Outcomes:

  • Faster response to machine alerts
  • Quality incidents traced to specific operator workflows
  • 4X faster access to insights led to improved inventory optimization.

As this case shows, real-time dashboards are not just operational tools—they’re strategic enablers. 

(Learn More: Powering the Future of Metal Manufacturing with Data Engineering)

Key Takeaways: Smart Manufacturing Dashboards at a Glance

AspectWhat You Should Know
1. Why Static Reports Fall ShortDelayed insights after issues occur
Disconnected systems (ERP, MES, sensors)
No real-time alerts or embedded decision logic
2. What Real-Time Dashboards EnableTrack OEE and downtime in real-time
Predictive maintenance using sensor data
Dynamic inventory heat maps
Quality linked to operators
3. Dashboards That Drive ActionRole-based views (operator to CEO)
Embedded alerts like “Line 4 down for 15+ mins”
Drilldowns from plant-level to machine-level
4. What Powers These DashboardsUnified Data Lakehouse (ERP + IoT + MES)
Real-time ETL pipelines
Power BI or custom dashboards built for frontline usability

Conclusion

Smart Manufacturing dashboards aren’t just analytics tools—they’re productivity engines. Dashboards that deliver real-time insight empower frontline teams to make faster, better decisions—whether it’s adjusting production schedules, triggering preventive maintenance, or responding to inventory fluctuations.

Explore how Mantra Labs can help you unlock operations intelligence that’s actually usable.

Cancel

Knowledge thats worth delivered in your inbox

Loading More Posts ...
Go Top
ml floating chatbot