Astronaut loading animation Circular loading bar

Try : Insurtech, Application Development

AgriTech(1)

Augmented Reality(20)

Clean Tech(5)

Customer Journey(12)

Design(36)

Solar Industry(6)

User Experience(56)

Edtech(10)

Events(34)

HR Tech(2)

Interviews(10)

Life@mantra(11)

Logistics(5)

Strategy(17)

Testing(9)

Android(47)

Backend(30)

Dev Ops(7)

Enterprise Solution(27)

Technology Modernization(2)

Frontend(28)

iOS(43)

Javascript(15)

AI in Insurance(35)

Insurtech(63)

Product Innovation(49)

Solutions(19)

E-health(10)

HealthTech(22)

mHealth(5)

Telehealth Care(4)

Telemedicine(5)

Artificial Intelligence(132)

Bitcoin(8)

Blockchain(19)

Cognitive Computing(7)

Computer Vision(8)

Data Science(17)

FinTech(50)

Banking(7)

Intelligent Automation(26)

Machine Learning(47)

Natural Language Processing(14)

expand Menu Filters

The Biggest Insurance Payouts in History

When the unforeseen strikes, insurance practices everywhere are left holding their breath as they lie in wait for the dreaded number – the damage loss estimates – to come in. These numbers are astronomical, to say the least. Almost 70% of all business financial losses arise from only ten circumstances – just ten! with the single largest identified cause being losses resulting from fires followed by aviation crashes and human-related errors.

Last year saw several natural catastrophes that triggered high insured loss amounts, including the California wildfires, and tropical cyclones that passed through Japan, the Philippines, the US and China. Now, insurers around the World are growing increasingly anxious, given the alarming frequency of occurrences in the past decade alone. The economic costs of last year’s 394 natural catastrophe events came up to $225B with insurance covering $90B of the overall total, creating the fourth costliest year on record of insured losses!

Munich Re NatCatSERVICE

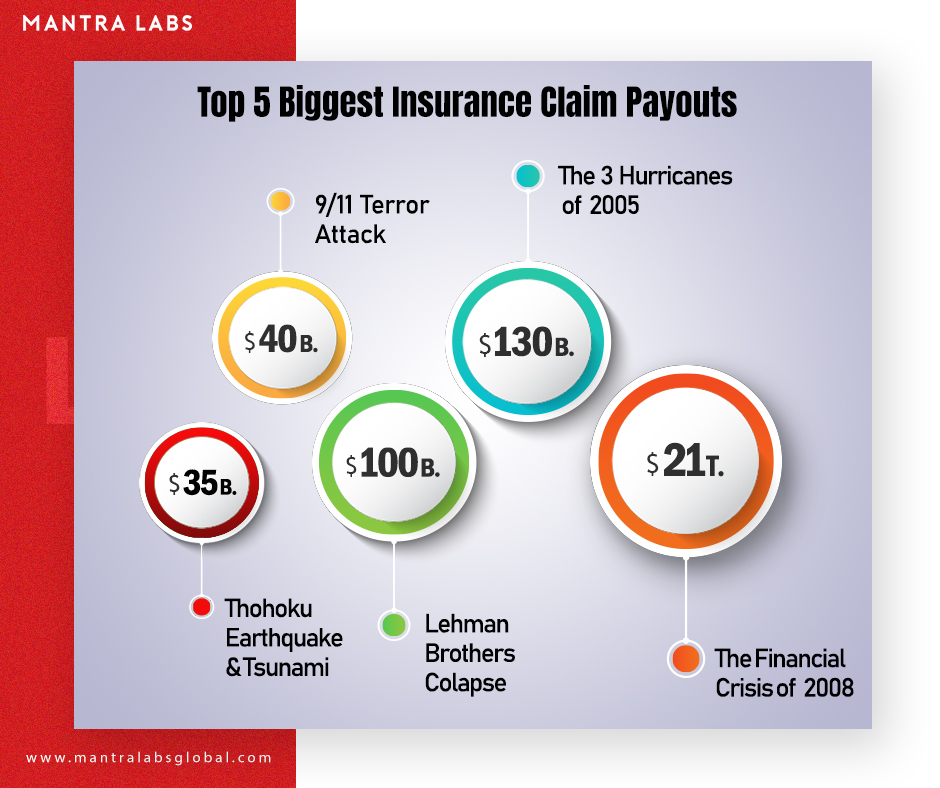
Regrettably, when the unforeseen strikes there is a severe loss to both life and property – and hence the substantial loss claims they create. While these figures are in no doubt staggering, they are merely to illustrate the incredible gap between those described above and the largest insurance payouts ever recorded. Here are the top five payouts, in order of value.

  1. The Tohoku Earthquake & Tsunami of 2011
    In March of 2011, at closer to three following noon, a 9.1 magnitude earthquake struck off-the coast of Japan. Within the next 30 minutes, while the aftermath of destruction was still being felt, 133 ft. waves rocketed into the sky from the ocean and travelled 10km inland, taking the lives of over fifteen thousand people. While the damages, for the earthquake alone, were estimated over $210B, only $35B was insured and ultimately paid out. The total combined payouts could be much higher.
  1. 9/11 Tragedy
    One of the most infamous and tragic terrorist attacks on a nation’s sovereign soil that will forever be entrenched in mankind’s memory. Soon after, ‘terrorism risk insurance’ became incredibly risky to cover for insurers. Congress reacted by passing the Terrorism Risk Insurance Act in 2002, which provided an assurance of government support after a catastrophic attack. The tragedy caused far-reaching damages that were difficult to estimate, triggering insurance payouts as much as $40B.
  1. Lehman Brothers Collapse
    At one point, the fourth largest investment bank in the U.S, the 158-year-old firm declared bankruptcy in 2008 after their involvement in shorting subprime mortgage loans through mortgage-backed securities sold in the secondary market from where the risk spread everywhere else. They filed for Chapter 11 protection after an exodus of most of its clients, and the devaluation of its assets by credit rating agencies. The insurance payouts to creditors, taxpayers and private investors totalled over $100B.
  1. The Three Hurricanes of 2005
    Three fierce, category-5 hurricanes: Katrina, Rita, and Wilma – hit the U.S., along with 28 other storms in 2005 causing massive damage across the lower half of the country. The storms moving at speeds exceeding 205km/hr caused damages to the tune of $169B. The insurance payouts for Hurricane Katrina alone totalled $45B. It is still one of the costliest natural disasters ever recorded in American history, with a total insurance payout of around $130B.
  1. The Financial crisis of 2008
    The global recession of 2008, that spread worldwide from the epicentre of the financial collapse in Wall St. triggered the greatest losses to both companies, individuals and families ever seen in the last hundred years. There is said to be a direct line between the actions of Lehman Brothers in the subprime mortgage crisis to the financial bedlam that endured worldwide, soon after. The payouts incurred by American insurers during that time, although a financially guarded secret, is believed to be as much as $21T – yes that’s T as in, a whopping ‘Twenty-One Trillion Dollars!’

Alliance Global Corporate & Specialty Report 2019

While $89B of the overall insured total of $90B was borne from weather-related disasters, insurers are actively monitoring climate change reports to take in a bigger view of the changes the planet is undergoing – following two back-to-back years of mega catastrophe-event losses.

The ‘Insurance Protection Gap’ or uninsured losses (the lower this value, the better), is a global problem that affects emerging nations and developed countries alike. Properties and economies with high insurance penetration recover much more quickly after a natural disaster than economies that rely on governments for their recovery.

The re/insurance industry continues to withstand the payouts backed up with $595B of capital. However, their focus will be on managing the cost of climate change and weather events by helping to further reduce the current protection gap of 60%.

References & Further Reading
https://www.agcs.allianz.com/news-and-insights/news/global-claims-review-2018.html

https://www.munichre.com/en/media-relations/publications/press-releases/2019/2019-01-08-press-release/index.html

https://www.insurancejournal.com/news/international/2019/01/22/515420.htm

https://www.mckinsey.com/industries/financial-services/our-insights/claims-in-the-digital-age

https://www.agcs.allianz.com/content/dam/onemarketing/agcs/agcs/reports/AGCS-Global-Claims-Review-2018.pdf

https://www.insurancejournal.com/news/international/2018/01/17/477266.htm

Cancel

Knowledge thats worth delivered in your inbox

10 Analytics Tools to Guide Data-Driven Design

Analytics are essential for informing website redesigns since they offer insightful data on user behavior, website performance, and areas that may be improved. Here is a list of frequently used analytics tools to guide data-driven design that can be applied at different stages of the website redesign process. 

Analytics Tools to Guide Data-Driven Design

1. Google Analytics:

Use case scenario: Website Audit, Research, Analysis, and Technical Assessment
Usage: Find popular sites, entry/exit points, and metrics related to user engagement by analyzing traffic sources, user demographics, and behavior flow. Recognize regions of friction or pain points by understanding user journeys. Evaluate the performance of your website, taking note of conversion rates, bounce rates, and page load times.

2. Hotjar:

Use case scenario: Research, Analysis, Heat Maps, User Experience Evaluation
Usage: Use session recordings, user surveys, and heatmaps to learn more about how people interact with the website. Determine the high and low engagement regions and any usability problems, including unclear navigation or form abandonment. Utilizing behavior analysis and feedback, ascertain the intentions and preferences of users.

3. Crazy Egg:
Use case scenario: Website Audit, Research, Analysis
Usage: Like Hotjar, with Crazy Egg, you can create heatmaps, scrollmaps, and clickmaps to show how users interact with the various website elements. Determine trends, patterns, and areas of interest in user behaviour. To evaluate various design aspects and gauge their effect on user engagement and conversions, utilize A/B testing functionalities.

4. SEMrush:

Use case scenario: Research, Analysis, SEO Optimization
Usage: Conduct keyword research to identify relevant search terms and phrases related to the website’s content and industry. Analyze competitor websites to understand their SEO strategies and identify opportunities for improvement. Monitor website rankings, backlinks, and organic traffic to track the effectiveness of SEO efforts.

5. Similarweb:
Use case
scenario: Research, Website Traffic, and Demography, Competitor Analysis
Usage: By offering insights into the traffic sources, audience demographics, and engagement metrics of competitors, Similarweb facilitates website redesigns. It influences marketing tactics, SEO optimization, content development, and decision-making processes by pointing out areas for growth and providing guidance. During the research and analysis stage, use Similarweb data to benchmark against competitors and guide design decisions.

6. Moz:
Use case scenario: Research, Analysis, SEO Optimization
Usage: Conduct website audits in order to find technical SEO problems like missing meta tags, duplicate content, and broken links. Keep an eye on a website’s indexability and crawlability to make sure search engines can access and comprehend its material. To find and reject backlinks that are spammy or of poor quality, use link analysis tools.

7. Ahrefs:
Use case scenario:
Research, Analysis, SEO Optimization

Usage: Examine the backlink profiles of your rivals to find any gaps in your own backlink portfolio and possible prospects for link-building. Examine the performance of your content to find the most popular pages and subjects that appeal to your target market. Track social media activity and brand mentions to gain insight into your online reputation and presence.

8. Google Search Console:

Use case scenario: Technical Assessment, SEO Optimization
Usage: Monitor website indexing status, crawl errors, and security issues reported by Google. Submit XML sitemaps and individual URLs for indexing. Identify and fix mobile usability issues, structured data errors, and manual actions that may affect search engine visibility.

9. Adobe Analytics:
Use case scenario:
Website Audit, Research, Analysis,
Usage: Track user interactions across multiple channels and touchpoints, including websites, mobile apps, and offline interactions. Segment users based on demographics, behavior, and lifecycle stage to personalize marketing efforts and improve user experience. Utilize advanced analytics features such as path analysis, cohort analysis, and predictive analytics to uncover actionable insights.

10. Google Trends:

Use case scenario: Content Strategy, Keyword Research, User Intent Analysis
Usage: For competitor analysis, user intent analysis, and keyword research, Google Trends is used in website redesigns. It helps in content strategy, seasonal planning, SEO optimization, and strategic decision-making. It directs the production of user-centric content, increasing traffic and engagement, by spotting trends and insights.

About the Author:

Vijendra is currently working as a Sr. UX Designer at Mantra Labs. He is passionate about UXR and Product Design.

Cancel

Knowledge thats worth delivered in your inbox

Loading More Posts ...
Go Top
ml floating chatbot