


4 minutes, 36 seconds read
Published on Oct 21, 2019
Updated on May 11, 2020
Create superior customer experiences to enhance competitive advantage.
Go from zero to breakthrough with scalable, future-proof solutions.
Harness deep tech for smarter solutions and maximum impact.
Accelerate value delivery with powerful pre-built digital tools.
Help businesses connect with an internet first generation.
Test the smarter way: where precision meets efficiency.
Unlock real-time and personalized customer journeys for mobile first generation.
Turn data into decisive action with scalable AI infrastructure.
Design agile digital foundations that scale with tomorrow's business needs.
Build new-age architecture for maximum efficiency and hyper-growth.
Fine-tune your cloud infrastructure for peak performance.
Automated compliance and control for global regulations.

All
Customer Experience
Mantra
Application Development
Insurtech
Digital Health
Insurance
Deep-Tech
AgriTech(1)
Augmented Reality(21)
Clean Tech(9)
Customer Journey(17)
Design(45)
Solar Industry(8)
User Experience(68)
Edtech(10)
Events(34)
HR Tech(3)
Interviews(10)
Life@mantra(11)
Logistics(6)
Manufacturing(5)
Strategy(18)
Testing(9)
Android(48)
Backend(32)
Dev Ops(11)
Enterprise Solution(33)
Technology Modernization(9)
Frontend(29)
iOS(43)
Javascript(15)
AI in Insurance(41)
Insurtech(67)
Product Innovation(59)
Solutions(22)
E-health(12)
HealthTech(25)
mHealth(5)
Telehealth Care(4)
Telemedicine(5)
Artificial Intelligence(154)
Bitcoin(8)
Blockchain(19)
Cognitive Computing(8)
Computer Vision(8)
Data Science(24)
FinTech(51)
Banking(7)
Intelligent Automation(27)
Machine Learning(48)
Natural Language Processing(14)
The insurance industry has been thriving to establish a strong connection with customers. The challenge is, however, intense with digital disruption and new avenues for customer risks. Insurance companies are catching the pace of the technological revolution and harnessing technology to bring more relevant products to the customers. While ‘customer satisfaction’ lies at the centre of businesses today, is insurance moving up the customer experience value chain? Let’s see.
Traditionally, a customer would call the insurance company during instances of claims. The customer would hear from the company only when the policy renewal time is approaching. This indicates the need for an ice-breaker in the insurance-customer relationship.
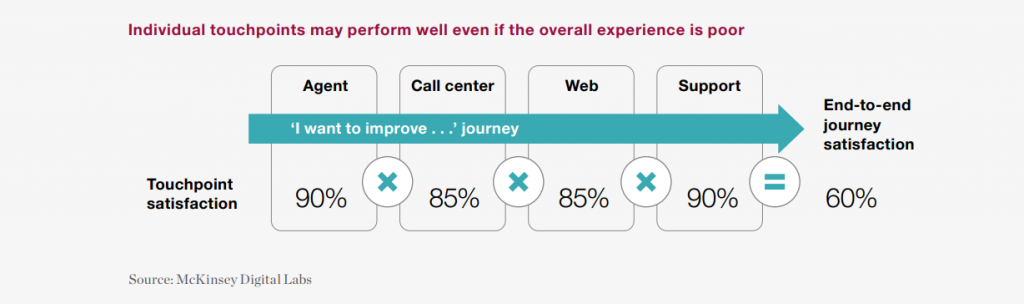
A decade ago, insurers intended to harmonize customer interactions — the touchpoints. Normally, any insurance company can have 4-7 customer touchpoints. Even though individual touchpoints are performing, the overall experience for a customer might not be satisfactory.
Customer satisfaction depends on five factors: interaction; price; policy offerings; billing & payment; and claims. However, to train the entire organization to see the interactions with customers’ eyes is still a challenge. It’s not possible to revamp the entire system overnight, but identifying the pain-points and acting upon them can surely move insurers up the ‘experience’ value chain.
For instance, the year 2014-15 witnessed one of the hefty market slowdowns in the automobile sector. Despite this, the millennials expressed an increase in satisfaction for their car-insurance services. The main reason for the increased satisfaction in the customer experience value chain was measurably improved interactions.
Resource: “Improved Interactions Drive Gen Y Increase in Auto Insurance Satisfaction.”
Addressing the fact that more touchpoints lead to more operational challenges and time to deliver results; insurers prototyped single-point-of-contact models during 2015-16. Here, a personalized agent would take care of the customer interactions. The results were profound, and this step is a milestone in defining the customer journey as a whole. McKinsey’s research finds that customer journeys are more strongly correlated with business outcomes than touchpoints.
Also read: Customer Journey is the New Product!
Today, organizations are leveraging technologies to speed-up processes like policy distribution, underwriting, and claim settlements. For instance, USAA (The United Services Automobile Association) is developing machine learning models to instantly predict vehicle damage from digital images and offer claim estimates.
According to Accenture, 76% of customers would switch providers for more personalized service and tailored product offerings. Insurers are, therefore, not only concerned about “what my customers want,” but also – “how my customers want.”
Organizations are using technology to provide tailored solutions to customers specific to their requirements. Artificial intelligence (AI), Machine Learning (ML), IoT, Blockchain, and Data analytics are strengthening the insurtech sector.
Carriers are using AI and ML to improve underwriting for mitigating risks. For example, Cape Analytics uses AI and geospatial imagery to provide instant property intelligence. Insurers can, therefore, accurately assess a property’s risk and value.
As mentioned before, claim settlement is one of the five major factors influencing customer satisfaction in insurance. Insurers are leveraging AI and cloud technology to settle claims in minutes or even less. For example, ICICI Lombard uses Cognitive Computing, Intelligent Character Recognition (ICR), and Optical Character Recognition (OCR) to automate the claim settlement process. Similarly for health insurance, ICICI Lombard is covering medical procedures like Cataract, Maternity, Appendicitis, Hemodialysis, and Hysterectomy for app-based claim settlement.
Also read – how AI can settle claims in 5 minutes!
Insurance companies are also automating workflows inline with their existing processes. It is helping insurers to bridge the technology gap between Gen X, Millennials, and Gen Z customers. Efficient insurance workflow automation solutions are trained to decipher industry-specific jargon and at the same time, interact with the user using NLP (Natural Language Processing) techniques.
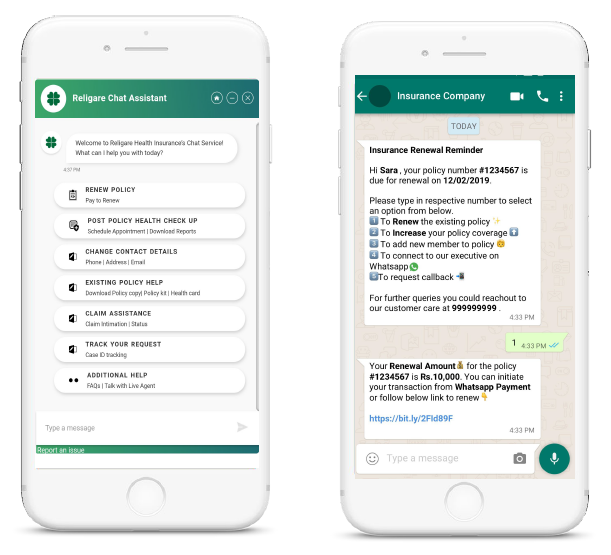
Another remarkable advancement in insurance CRM is the adoption of chatbots. It is a viable solution to serve multiple customers concurrently. For example, Religare, a leading insurer was able to increase customer interactions by 10x through chatbots.
The present time also sees customers’ growing intent towards micro policies, which serve a single purpose instead of an all-encompassing insurance scheme. Technology is also helping to distribute micro policies in scale with almost zero upfront costs. For example, Gramcover, an Indian microinsurance startup uses direct-document uploading and processing for distributing policies in rural areas.
The World InsurTech Report 2019 indicates that less than 25% of business customers and 15% retail policyholders believe they’re covered against all emerging risks. However, 28% of individual customers are amenable to share additional data for more comprehensive services. Also, 15% of customers are willing to pay an additional fee for relevant services.
The takeaway — ‘relevance’ is the key to today’s customers. Insurance companies can leverage this opportunity to provide products related to emerging threats like identity theft, privacy invasion, misuse of personal information, and attacks from ransomware.
In 2018, about 30% of customers selected their insurer in a single day, according to a survey from the Insurance Information Institute. Through creating exceptional customer experiences, insurers can set themselves apart from their competitors. And the answer to ‘how’ to create this exceptional experience lies in focusing on the journey more than the customer touchpoints.
The customer interaction preferences will keep on changing. Today, millennials prefer to interact with insurers via digital self-service. Tomorrow, Gen Z might want complete automation, i.e. no interaction at all. How fast the insurance industry adapts to the changing preferences will determine the level of satisfaction in the customer experience value chain.
We provide insurtech solutions for business-specific challenges. Feel free to drop us a line at hello@mantralabsglobal.com, illustrating your requirements.
Knowledge thats worth delivered in your inbox
Smart Manufacturing starts with real-time visibility.
Manufacturing companies today generate data by the second through sensors, machines, ERP systems, and MES platforms. But without real-time insights, even the most advanced production lines are essentially flying blind.
Manufacturers are implementing real-time dashboards that serve as control towers for their daily operations, enabling them to shift from reactive to proactive decision-making. These tools are essential to the evolution of Smart Manufacturing, where connected systems, automation, and intelligent analytics come together to drive measurable impact.
Data is available, but what’s missing is timely action.
For many plant leaders and COOs, one challenge persists: operational data is dispersed throughout systems, delayed, or hidden in spreadsheets. And this delay turns into a liability.
Real-time dashboards help uncover critical answers:
By converting raw inputs into real-time manufacturing analytics, dashboards make operational intelligence accessible to operators, supervisors, and leadership alike, enabling teams to anticipate problems rather than react to them.
Line performance and downtime trends
Track OEE in real time and identify underperforming lines.
Predictive maintenance alerts
Utilize historical and sensor data to identify potential part failures in advance.
Inventory heat maps & reorder thresholds
Anticipate stockouts or overstocks based on dynamic reorder points.
Quality metrics linked to operator actions
Isolate shifts or procedures correlated with spikes in defects or rework.
These insights allow production teams to drive day-to-day operations in line with Smart Manufacturing principles.
Role-based dashboards
Dashboards can be configured for machine operators, shift supervisors, and plant managers, each with a tailored view of KPIs.
Embedded alerts and nudges
Real-time prompts, like “Line 4 below efficiency threshold for 15+ minutes,” reduce response times and minimize disruptions.
Cross-functional drill-downs
Teams can identify root causes more quickly because users can move from plant-wide overviews to detailed machine-level data in seconds.
Data lakehouse integration
Unified access to ERP, MES, IoT sensor, and QA systems—ensuring reliable and timely manufacturing analytics.
ETL pipelines
Real-time data ingestion from high-frequency sources with minimal latency.
Visualization tools
Custom builds using Power BI, or customized solutions designed for frontline usability and operational impact.
Mantra Labs partnered with a North American die-casting manufacturer to unify its operational data into a real-time dashboard. Fragmented data, manual reporting, delayed pricing decisions, and inconsistent data quality hindered operational efficiency and strategic decision-making.
As this case shows, real-time dashboards are not just operational tools—they’re strategic enablers.
(Learn More: Powering the Future of Metal Manufacturing with Data Engineering)
| Aspect | What You Should Know |
| 1. Why Static Reports Fall Short | Delayed insights after issues occur Disconnected systems (ERP, MES, sensors) No real-time alerts or embedded decision logic |
| 2. What Real-Time Dashboards Enable | Track OEE and downtime in real-time Predictive maintenance using sensor data Dynamic inventory heat maps Quality linked to operators |
| 3. Dashboards That Drive Action | Role-based views (operator to CEO) Embedded alerts like “Line 4 down for 15+ mins” Drilldowns from plant-level to machine-level |
| 4. What Powers These Dashboards | Unified Data Lakehouse (ERP + IoT + MES) Real-time ETL pipelines Power BI or custom dashboards built for frontline usability |
Smart Manufacturing dashboards aren’t just analytics tools—they’re productivity engines. Dashboards that deliver real-time insight empower frontline teams to make faster, better decisions—whether it’s adjusting production schedules, triggering preventive maintenance, or responding to inventory fluctuations.
Explore how Mantra Labs can help you unlock operations intelligence that’s actually usable.
Knowledge thats worth delivered in your inbox


Our Sales Team will be in touch with you shortly.

Hello Stranger! Please fill in a few details,and you’ll receive a link to this case study.
 We have mailed you this case study.
Thanks for subscribing.
