


4 minutes read
Published on Sep 28, 2022
Create superior customer experiences to enhance competitive advantage.
Go from zero to breakthrough with scalable, future-proof solutions.
Harness deep tech for smarter solutions and maximum impact.
Accelerate value delivery with powerful pre-built digital tools.
Help businesses connect with an internet first generation.
Test the smarter way: where precision meets efficiency.
Unlock real-time and personalized customer journeys for mobile first generation.
Turn data into decisive action with scalable AI infrastructure.
Design agile digital foundations that scale with tomorrow's business needs.
Build new-age architecture for maximum efficiency and hyper-growth.
Fine-tune your cloud infrastructure for peak performance.
Automated compliance and control for global regulations.

All
Customer Experience
Mantra
Application Development
Insurtech
Digital Health
Insurance
Deep-Tech
AgriTech(1)
Augmented Reality(21)
Clean Tech(9)
Customer Journey(17)
Design(45)
Solar Industry(8)
User Experience(68)
Edtech(10)
Events(34)
HR Tech(3)
Interviews(10)
Life@mantra(11)
Logistics(6)
Manufacturing(5)
Strategy(18)
Testing(9)
Android(48)
Backend(32)
Dev Ops(11)
Enterprise Solution(33)
Technology Modernization(9)
Frontend(29)
iOS(43)
Javascript(15)
AI in Insurance(41)
Insurtech(67)
Product Innovation(59)
Solutions(22)
E-health(12)
HealthTech(25)
mHealth(5)
Telehealth Care(4)
Telemedicine(5)
Artificial Intelligence(154)
Bitcoin(8)
Blockchain(19)
Cognitive Computing(8)
Computer Vision(8)
Data Science(24)
FinTech(51)
Banking(7)
Intelligent Automation(27)
Machine Learning(48)
Natural Language Processing(14)
This article is for enthusiasts who strive to write clean, scalable, and more importantly refactorable code. It will give an idea about how Nest.JS can help us write clean code and what underlying architecture it uses.
Implementing a clean architecture with Nest.JS will require us to first comprehend what this framework is and how it works.
Nest or Nest.JS is a framework for building efficient, scalable Node.js applications (server-side) built with TypeScript. It uses Express or Fastify and allows a level of abstraction to enable developers to use an ample amount of modules (third-party) within their code.
Let’s dig deeper into what is this clean architecture all about.
Well, you all might have used or at least heard of MVC architecture. MVC stands for Model, View, Controller. The idea behind this is to separate our project structure into 3 different sections.
1. Model: It will contain the Object file which maps with Relation/Documents in the DB.
2. Controller: It is the request handler and is responsible for the business logic implementation and all the data manipulation.
3. View: This part will contain files that are concerned with the displaying of the data, either HTML files or some templating engine files.
To create a model, we need some kind of ORM/ODM tool/module/library to build it with. For instance, if you directly use the module, let’s say ‘sequelize’, and then use the same to implement login in your controller and make your core business logic dependent upon the ‘sequelize’. Now, down the line, let’s say after 10 years, there is a better tool in the market that you want to use, but as soon as you replace sequelize with it, you will have to change lots of lines of code to prevent it from breaking. Also, you’ll have to test all the features once again to check if it’s deployed successfully or not which may waste valuable time and resource as well. To overcome this challenge, we can use the last principle of SOLID which is the Dependency Inversion Principle, and a technique called dependency injection to avoid such a mess.
Still confused? Let me explain in detail.
So, what Dependency Inversion Principle says in simple words is, you create your core business logic and then build dependency around it. In other words, free your core logic and business rules from any kind of dependency and modify the outer layers in such a way that they are dependent on your core logic instead of your logic dependent on this. That’s what clean architecture is. It takes out the dependency from your core business logic and builds the system around it in such a way that they seem to be dependent on it rather than it being dependent on them.
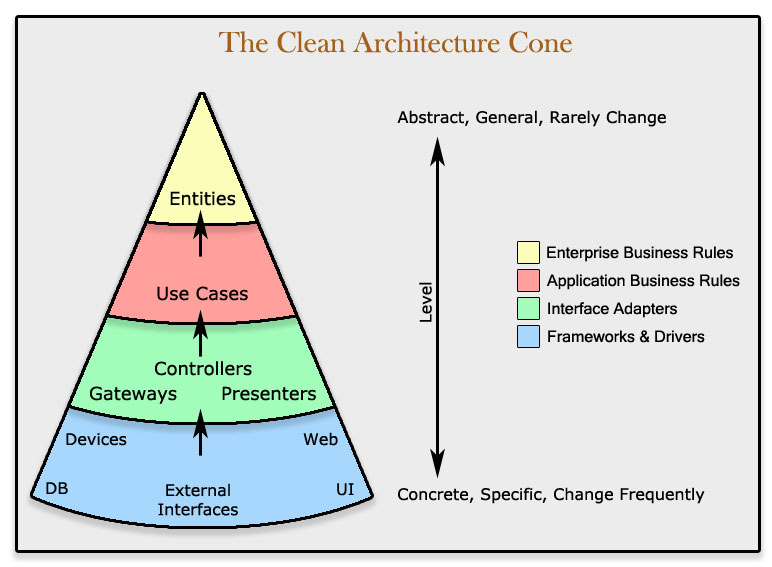
Let’s try to understand this with the below diagram.

Source: Clean Architecture Cone
You can see that we have divided our architecture into 4 layers:
1. Entities: At its core, entities are the models(Enterprise rules) that define your enterprise rules and tell what the application is about. This layer will hardly change over time and is usually abstract and not accessible directly. For eg., every application has a ‘user’. What all fields the user should store, their types, and relations with other entities will comprise an Entity.
2. Use cases: It tells us how can we implement the enterprise rules. Let’s take the example of the user again. Now we know what data to be operated upon, the use case tells us how to operate upon this data, like the user will have a password that needs to be encrypted, the user needs to be created, and the password can be changed at any given point of time, etc.
3. Controllers/Gateways: These are channels that help us to implement the use cases using external tools and libraries using dependency injection.
4. External Tools: All the tools and libraries we use to build our logic will come under this layer eg. ORM, Emailer, Encryption, etc.
The tools we use will be depending upon how we channel them to use cases and in turn, use cases will depend upon the entities which is the core of our business. This way we have inverted the dependency from outwards to inwards. That’s what the Dependency Inversion Principal of SOLID implies.
Okay, by now, you got the gist of Nest.JS and understood how clean architecture works. Now the question arises, how these two are related?
Let’s try to understand what are the 3 building blocks of Nest.JS and what each of them does.
To summarize,
Conclusion:
Nest.JS is a powerful Node.JS framework and the most well-known typescript available today. Now that you’ve got the lowdown on this framework, you must be wondering if we can use it to build a project structure with a clean architecture. Well, the answer is -Yes! Absolutely. How? I’ll explain in the next series of this article.
Till then, Stay tuned!
About the Author:
Junaid Bhat is currently working as a Tech Lead in Mantra Labs. He is a tech enthusiast striving to become a better engineer every day by following industry standards and aligned towards a more structured approach to problem-solving.
Read our latest blog: Golang-Beego Framework and its Applications
Knowledge thats worth delivered in your inbox
Smart Manufacturing starts with real-time visibility.
Manufacturing companies today generate data by the second through sensors, machines, ERP systems, and MES platforms. But without real-time insights, even the most advanced production lines are essentially flying blind.
Manufacturers are implementing real-time dashboards that serve as control towers for their daily operations, enabling them to shift from reactive to proactive decision-making. These tools are essential to the evolution of Smart Manufacturing, where connected systems, automation, and intelligent analytics come together to drive measurable impact.
Data is available, but what’s missing is timely action.
For many plant leaders and COOs, one challenge persists: operational data is dispersed throughout systems, delayed, or hidden in spreadsheets. And this delay turns into a liability.
Real-time dashboards help uncover critical answers:
By converting raw inputs into real-time manufacturing analytics, dashboards make operational intelligence accessible to operators, supervisors, and leadership alike, enabling teams to anticipate problems rather than react to them.
Line performance and downtime trends
Track OEE in real time and identify underperforming lines.
Predictive maintenance alerts
Utilize historical and sensor data to identify potential part failures in advance.
Inventory heat maps & reorder thresholds
Anticipate stockouts or overstocks based on dynamic reorder points.
Quality metrics linked to operator actions
Isolate shifts or procedures correlated with spikes in defects or rework.
These insights allow production teams to drive day-to-day operations in line with Smart Manufacturing principles.
Role-based dashboards
Dashboards can be configured for machine operators, shift supervisors, and plant managers, each with a tailored view of KPIs.
Embedded alerts and nudges
Real-time prompts, like “Line 4 below efficiency threshold for 15+ minutes,” reduce response times and minimize disruptions.
Cross-functional drill-downs
Teams can identify root causes more quickly because users can move from plant-wide overviews to detailed machine-level data in seconds.
Data lakehouse integration
Unified access to ERP, MES, IoT sensor, and QA systems—ensuring reliable and timely manufacturing analytics.
ETL pipelines
Real-time data ingestion from high-frequency sources with minimal latency.
Visualization tools
Custom builds using Power BI, or customized solutions designed for frontline usability and operational impact.
Mantra Labs partnered with a North American die-casting manufacturer to unify its operational data into a real-time dashboard. Fragmented data, manual reporting, delayed pricing decisions, and inconsistent data quality hindered operational efficiency and strategic decision-making.
As this case shows, real-time dashboards are not just operational tools—they’re strategic enablers.
(Learn More: Powering the Future of Metal Manufacturing with Data Engineering)
| Aspect | What You Should Know |
| 1. Why Static Reports Fall Short | Delayed insights after issues occur Disconnected systems (ERP, MES, sensors) No real-time alerts or embedded decision logic |
| 2. What Real-Time Dashboards Enable | Track OEE and downtime in real-time Predictive maintenance using sensor data Dynamic inventory heat maps Quality linked to operators |
| 3. Dashboards That Drive Action | Role-based views (operator to CEO) Embedded alerts like “Line 4 down for 15+ mins” Drilldowns from plant-level to machine-level |
| 4. What Powers These Dashboards | Unified Data Lakehouse (ERP + IoT + MES) Real-time ETL pipelines Power BI or custom dashboards built for frontline usability |
Smart Manufacturing dashboards aren’t just analytics tools—they’re productivity engines. Dashboards that deliver real-time insight empower frontline teams to make faster, better decisions—whether it’s adjusting production schedules, triggering preventive maintenance, or responding to inventory fluctuations.
Explore how Mantra Labs can help you unlock operations intelligence that’s actually usable.
Knowledge thats worth delivered in your inbox


Our Sales Team will be in touch with you shortly.

Hello Stranger! Please fill in a few details,and you’ll receive a link to this case study.
 We have mailed you this case study.
Thanks for subscribing.
