Published on Apr 12, 2023
Updated on Feb 12, 2024
Create superior customer experiences to enhance competitive advantage.
Go from zero to breakthrough with scalable, future-proof solutions.
Harness deep tech for smarter solutions and maximum impact.
Accelerate value delivery with powerful pre-built digital tools.
Help businesses connect with an internet first generation.
Test the smarter way: where precision meets efficiency.
Unlock real-time and personalized customer journeys for mobile first generation.
Turn data into decisive action with scalable AI infrastructure.
Design agile digital foundations that scale with tomorrow's business needs.
Build new-age architecture for maximum efficiency and hyper-growth.
Fine-tune your cloud infrastructure for peak performance.
Automated compliance and control for global regulations.

All
Customer Experience
Mantra
Application Development
Insurtech
Digital Health
Insurance
Deep-Tech
AgriTech(1)
Augmented Reality(21)
Clean Tech(9)
Customer Journey(17)
Design(45)
Solar Industry(8)
User Experience(68)
Edtech(10)
Events(34)
HR Tech(3)
Interviews(10)
Life@mantra(11)
Logistics(6)
Manufacturing(5)
Strategy(18)
Testing(9)
Android(48)
Backend(32)
Dev Ops(11)
Enterprise Solution(33)
Technology Modernization(9)
Frontend(29)
iOS(43)
Javascript(15)
AI in Insurance(41)
Insurtech(67)
Product Innovation(59)
Solutions(22)
E-health(12)
HealthTech(25)
mHealth(5)
Telehealth Care(4)
Telemedicine(5)
Artificial Intelligence(154)
Bitcoin(8)
Blockchain(19)
Cognitive Computing(8)
Computer Vision(8)
Data Science(24)
FinTech(51)
Banking(7)
Intelligent Automation(27)
Machine Learning(48)
Natural Language Processing(14)
The solar power industry in the United States has seen impressive growth in recent years. As a result of growing environmental concerns over the rise in carbon emissions caused by the usage of traditional fuels for transportation and power generation, modern consumers have become more conscious now. The government has also provided evident tax benefits for installing solar PVs.
Here’s what the industry has achieved so far:
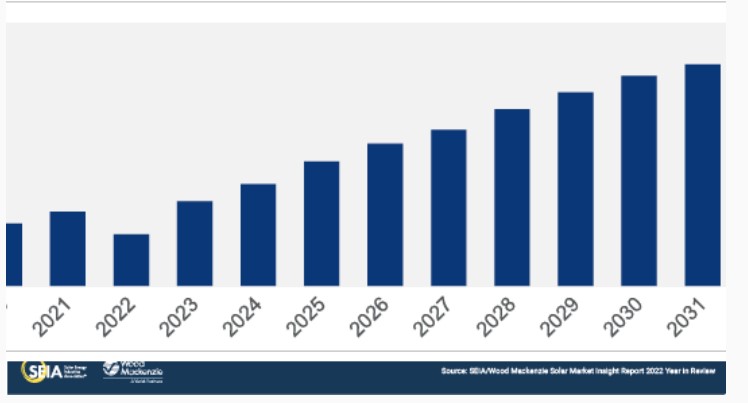
As per the report released by SEIA, Solar accounted for 50% of all new electricity-generating capacity added to the US grid in 2022, the fourth consecutive year that solar was the top technology for new additions. The country installed 20.2 gigawatts (GWdc) of solar PV capacity, bringing the total installed capacity to 142.3 GWdc, enough to power 25 million homes last year. Further, it is projected that the total base of installed solar will be five times larger in 2033 than it is today.
Source: SEIA
What do solar customers want?
With the rising popularity of solar panels as an alternative, customers are getting curious about the hows and whats of it. Every customer is different. This is why it becomes imperative for organizations to understand what each specific customer is interested in and what expectations they have.
Tech Savvy CX is becoming a game changer for the solar industry. Organizations are addressing customer needs with the advent of advanced technology, paired with data analytics. Many companies have already identified the pain points and have come up with excellent solutions to address them.
Technology’s potential capabilities in the solar panel Industry:
Some interesting Use Cases:
Green Brilliance: Considered one of the top 10 solar contractors in the United States, Green Brilliance provides an end-to-end solar system that is designed, installed, monitored, and maintained in-house. They partnered with Mantra Labs to empower solar panel customers in the US with a digital platform that addresses customer-centric problems such as visibility on the installation process, savings, and budgeting concerns, financing options, installation impact, and more.
Sunpower Solar: SunPower sells premium solar panels and offers financing options like loans and leases. Customers can also track their energy usage and keep an eye on the performance of their solar system with the help of a mobile app. In addition to all this, Sunpower has an interesting feature called Design Studio on their website which, with the help of a video, explains how to use their app to create a personalized design of one’s roof, detect obstructions and make a customized layout according to a customer’s energy consumption.
Momentum Solar: Momentum Solar’s customer experience strategy on its website is designed with a user-friendly interface that allows visitors to navigate and find the information they need easily. They also offer a variety of resources, such as a solar savings calculator and an FAQ section, to help educate their customers on the benefits of solar energy and how the process works. Overall, Momentum Solar’s customer experience strategy on its website is centered around transparency, education, and exceptional service.
Conclusion:
Today’s consumers are moving more towards a financially and environmentally conscious lifestyle. They expect a better customer experience everywhere, be it buying a grocery, insurance, ordering food, booking a cab, or buying a solar panel. It has become the need of the hour for companies to shift their focus on enhancing the overall experience of the customers and making the entire purchase process as smooth as possible.
As competition becomes more intense in the solar industry, it will be interesting to see how firms will leverage technology to provide innovative solutions for solar panel customers. As a solar panel consumer, what is the biggest blocker you find while thinking about installing solar panels at your home?
Knowledge thats worth delivered in your inbox
Smart Manufacturing starts with real-time visibility.
Manufacturing companies today generate data by the second through sensors, machines, ERP systems, and MES platforms. But without real-time insights, even the most advanced production lines are essentially flying blind.
Manufacturers are implementing real-time dashboards that serve as control towers for their daily operations, enabling them to shift from reactive to proactive decision-making. These tools are essential to the evolution of Smart Manufacturing, where connected systems, automation, and intelligent analytics come together to drive measurable impact.
Data is available, but what’s missing is timely action.
For many plant leaders and COOs, one challenge persists: operational data is dispersed throughout systems, delayed, or hidden in spreadsheets. And this delay turns into a liability.
Real-time dashboards help uncover critical answers:
By converting raw inputs into real-time manufacturing analytics, dashboards make operational intelligence accessible to operators, supervisors, and leadership alike, enabling teams to anticipate problems rather than react to them.
Line performance and downtime trends
Track OEE in real time and identify underperforming lines.
Predictive maintenance alerts
Utilize historical and sensor data to identify potential part failures in advance.
Inventory heat maps & reorder thresholds
Anticipate stockouts or overstocks based on dynamic reorder points.
Quality metrics linked to operator actions
Isolate shifts or procedures correlated with spikes in defects or rework.
These insights allow production teams to drive day-to-day operations in line with Smart Manufacturing principles.
Role-based dashboards
Dashboards can be configured for machine operators, shift supervisors, and plant managers, each with a tailored view of KPIs.
Embedded alerts and nudges
Real-time prompts, like “Line 4 below efficiency threshold for 15+ minutes,” reduce response times and minimize disruptions.
Cross-functional drill-downs
Teams can identify root causes more quickly because users can move from plant-wide overviews to detailed machine-level data in seconds.
Data lakehouse integration
Unified access to ERP, MES, IoT sensor, and QA systems—ensuring reliable and timely manufacturing analytics.
ETL pipelines
Real-time data ingestion from high-frequency sources with minimal latency.
Visualization tools
Custom builds using Power BI, or customized solutions designed for frontline usability and operational impact.
Mantra Labs partnered with a North American die-casting manufacturer to unify its operational data into a real-time dashboard. Fragmented data, manual reporting, delayed pricing decisions, and inconsistent data quality hindered operational efficiency and strategic decision-making.
As this case shows, real-time dashboards are not just operational tools—they’re strategic enablers.
(Learn More: Powering the Future of Metal Manufacturing with Data Engineering)
| Aspect | What You Should Know |
| 1. Why Static Reports Fall Short | Delayed insights after issues occur Disconnected systems (ERP, MES, sensors) No real-time alerts or embedded decision logic |
| 2. What Real-Time Dashboards Enable | Track OEE and downtime in real-time Predictive maintenance using sensor data Dynamic inventory heat maps Quality linked to operators |
| 3. Dashboards That Drive Action | Role-based views (operator to CEO) Embedded alerts like “Line 4 down for 15+ mins” Drilldowns from plant-level to machine-level |
| 4. What Powers These Dashboards | Unified Data Lakehouse (ERP + IoT + MES) Real-time ETL pipelines Power BI or custom dashboards built for frontline usability |
Smart Manufacturing dashboards aren’t just analytics tools—they’re productivity engines. Dashboards that deliver real-time insight empower frontline teams to make faster, better decisions—whether it’s adjusting production schedules, triggering preventive maintenance, or responding to inventory fluctuations.
Explore how Mantra Labs can help you unlock operations intelligence that’s actually usable.
Knowledge thats worth delivered in your inbox


Our Sales Team will be in touch with you shortly.

Hello Stranger! Please fill in a few details,and you’ll receive a link to this case study.
 We have mailed you this case study.
Thanks for subscribing.