


Published on Apr 23, 2019
Updated on Feb 20, 2020
Create superior customer experiences to enhance competitive advantage.
Go from zero to breakthrough with scalable, future-proof solutions.
Harness deep tech for smarter solutions and maximum impact.
Accelerate value delivery with powerful pre-built digital tools.
Help businesses connect with an internet first generation.
Test the smarter way: where precision meets efficiency.
Unlock real-time and personalized customer journeys for mobile first generation.
Turn data into decisive action with scalable AI infrastructure.
Design agile digital foundations that scale with tomorrow's business needs.
Build new-age architecture for maximum efficiency and hyper-growth.
Fine-tune your cloud infrastructure for peak performance.
Automated compliance and control for global regulations.

All
Customer Experience
Mantra
Application Development
Insurtech
Digital Health
Insurance
Deep-Tech
AgriTech(1)
Augmented Reality(21)
Clean Tech(9)
Customer Journey(17)
Design(45)
Solar Industry(8)
User Experience(68)
Edtech(10)
Events(34)
HR Tech(3)
Interviews(10)
Life@mantra(11)
Logistics(6)
Manufacturing(5)
Strategy(18)
Testing(9)
Android(48)
Backend(32)
Dev Ops(11)
Enterprise Solution(33)
Technology Modernization(9)
Frontend(29)
iOS(43)
Javascript(15)
AI in Insurance(41)
Insurtech(67)
Product Innovation(59)
Solutions(22)
E-health(12)
HealthTech(25)
mHealth(5)
Telehealth Care(4)
Telemedicine(5)
Artificial Intelligence(154)
Bitcoin(8)
Blockchain(19)
Cognitive Computing(8)
Computer Vision(8)
Data Science(24)
FinTech(51)
Banking(7)
Intelligent Automation(27)
Machine Learning(48)
Natural Language Processing(14)
Convolutional Neural Networks (CNN) have come a long way in conveniently identifying objects in images and videos. Networks like VGG19, ResNet, YOLO, SSD, R-CNN, DensepathNet, DualNet, Xception, Inception, PolyNet, MobileNet, and many more have evolved over time. Their range of applications lies in detecting space availability in a parking lot, satellite image analysis to track ships and agricultural output, radiology, people count, detecting words in vehicle license plates and storefronts, circuits/machinery fault analysis, medical diagnosis, etc.
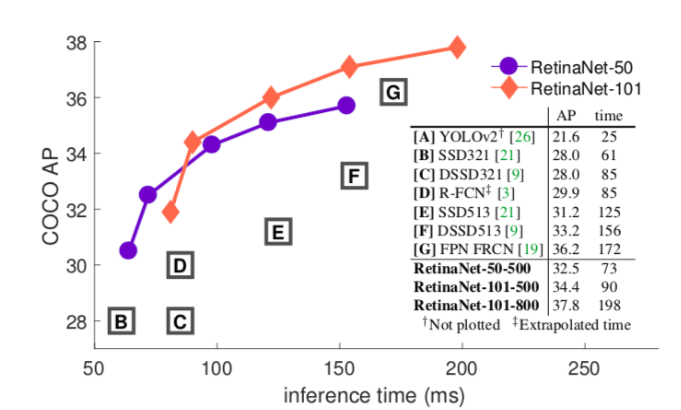
Facebook AI Research (FAIR) has recently published RetinaNet architecture which uses Feature Pyramid Network (FPN) with ResNet. This architecture demonstrates higher accuracy in situations where speed is not really important. RetinaNet is built on top of FPN using ResNet.
Google offers benchmark comparison to calculate tradeoff between speed and accuracy of various networks using MS COCO dataset to train the models in TensorFlow. It gives us a benchmark to understand the best model that provides a balance between speed and accuracy. According to researchers, Faster R-CNN is more accurate, whereas R-FCN and FCN show better inference time (i.e. their speed is higher). Inception and ResNet are implementations of Faster R-CNN. MobileNet is an implementation of SSD.
Faster R-CNN implementations show an overall mAP (mean average precision) of around 30, which is highest for feature extraction. And, at the same time, its accuracy is also highest at around 80.5%. MobileNet R-FCN implementation has a lower mAP of around 15. Therefore, its accuracy drops down to about 71.5%.
Thus, we can say — SSD implementations work best for detecting larger objects whereas, Faster R-CNN and R-FCN are better at detecting small objects.
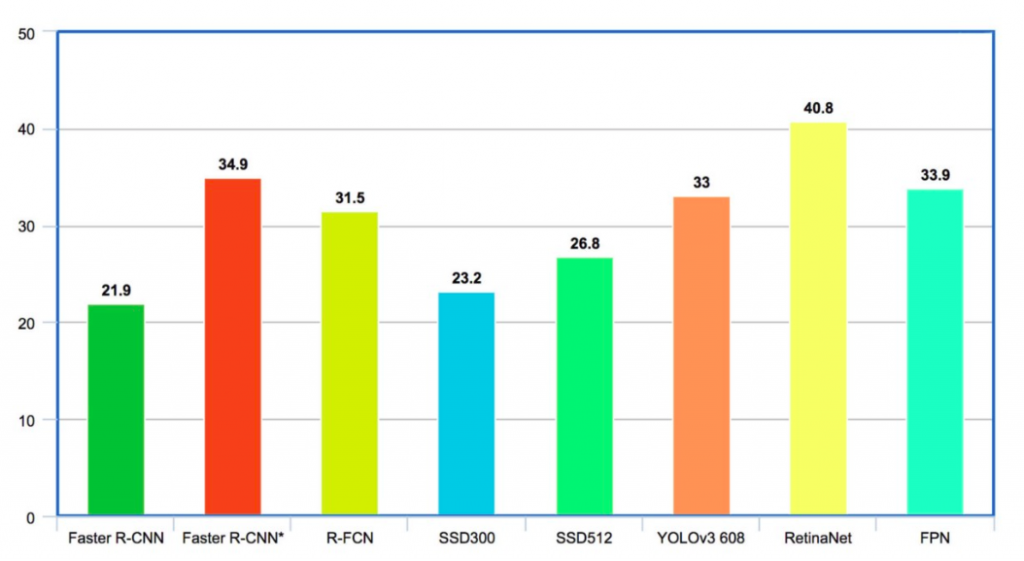
On the COCO dataset, Faster R-CNN has average mAP for IoU (intersection-over-union) from 0.5 to 0.95 (mAP@[0.5, 0.95]) as 21.9% . R-FCN has mAP of 31.5% . SSD300 and SSD512 have mAPs of 23.2 and 26.8 respectively . YOLO-V2 is at 21.6% whereas YOLO-V3 is at 33% . FPN delivers 33.9% . RetinaNet stands highest at 40.8%.
A One-stage detector scans for candidate objects sampled for around 100000 locations in the image that densely covers the spatial extent. This does not let the class balance between background and foreground.
A Two-stage detector first narrows down the number of candidate objects on up to 2000 locations and separates them from the background in the first stage. It then classifies each candidate object in the second stage, thus managing the class balance. But, because of the smaller number of locations in the sample, many objects might escape detection.
Faster R-CNN is an implementation of the two-stage detector. RetinaNet, an implementation of one stage detector addresses this class imbalance and efficiently detects all objects.
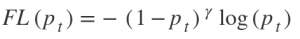
This function focuses on training on hard negatives. It is defined as-
Where,
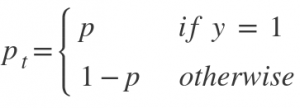
and p = sigmoid output score.
The greeks are hyperparameters.
When a sample classification is inappropriate and pₜ is small, it does not affect the loss. Gamma is a focusing parameter and adjusts the rate at which the easy samples are down-weighted. Samples get down-weighted when their classification is inappropriate and pₜ is close to 1. When gamma is 0, the focal loss is close to the cross-entropy loss. Upon increasing gamma, the effect of modulating factor also increases.
The new loss function called Focal loss increases the accuracy significantly. Essentially it is a one-stage detector Feature Pyramid Network with Focal loss replacing the cross-entropy loss.
Hard negative mining in a single shot detector and Faster R-CNN addresses the class imbalance by downsampling the dominant samples. On the contrary, RetinaNet addresses it by changing the weights in the loss function. The following diagram explains the architecture.
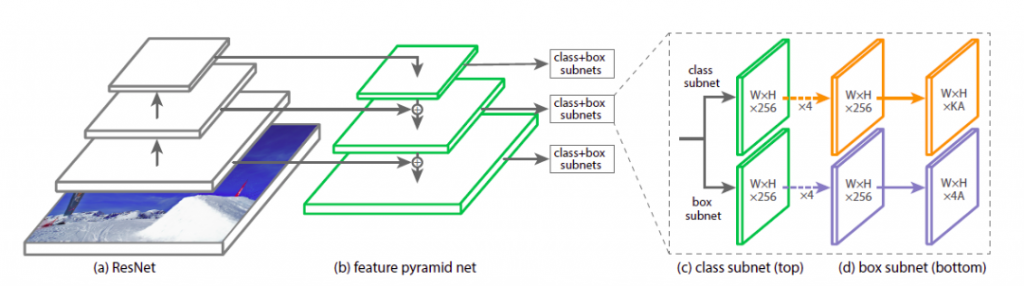
Here, deep feature extraction uses ResNet. Using FPN on top of ResNet further helps in constructing a multi-scale feature pyramid from a single resolution image. FPN is fast to compute and works efficiently on multiscale.
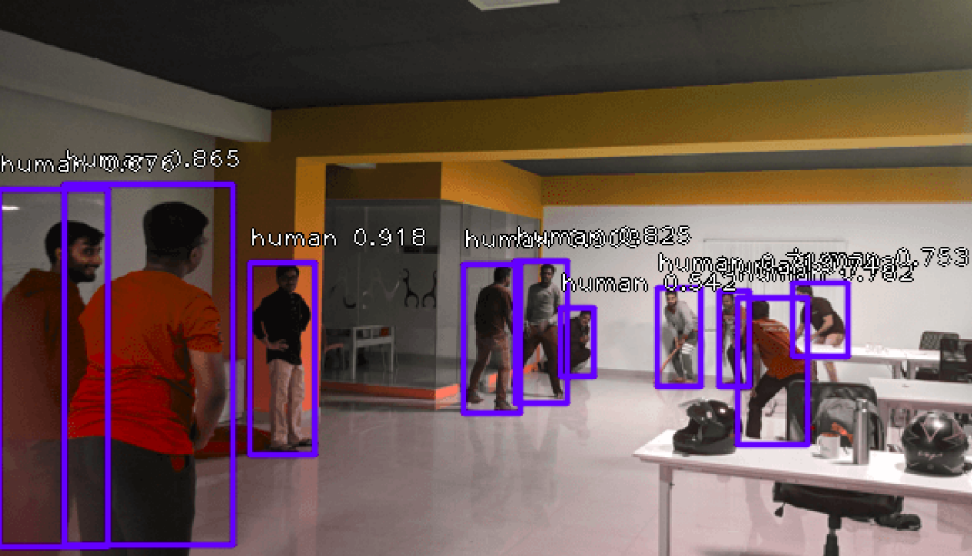
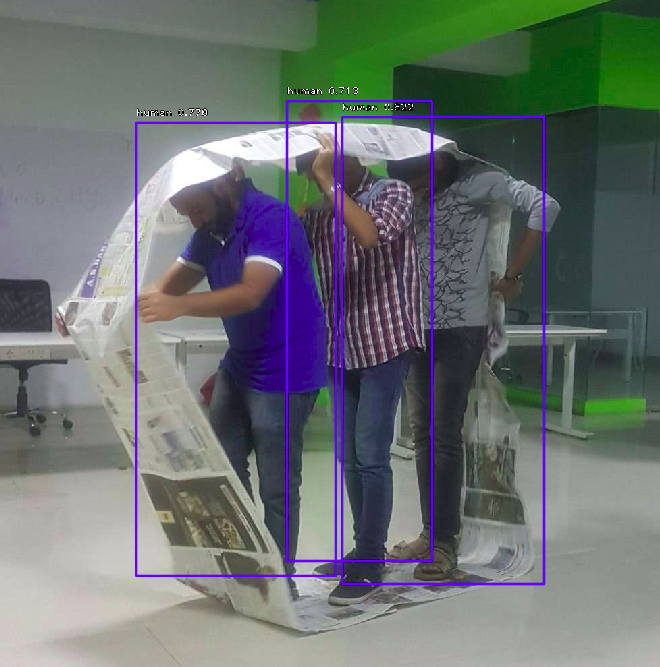
We used ResNet50-FPN pre-trained on MS COCO to identify humans in the photo. The threshold is set above a score of 0.5. The following images show the result with markings and confidence values.
We further tried to detect other objects like chairs.
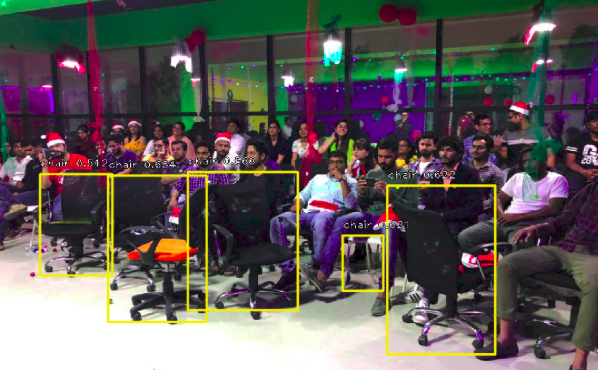
Conclusion: It’s great to know that training on the COCO dataset can detect objects from unknown scenes. The object detection in the scenes took 5-7 seconds. So far, we have put filters of human or chair in results. RetinaNet can detect all the identifiable objects in the scene.
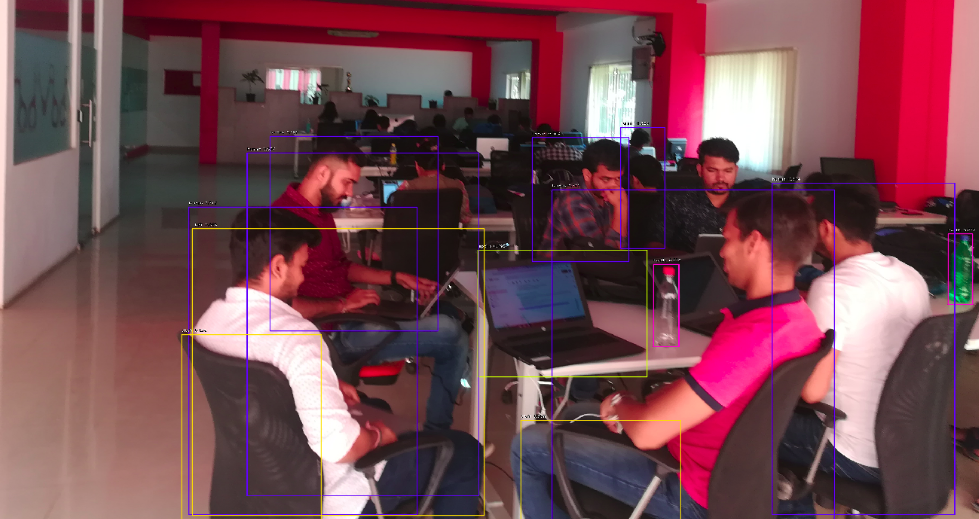
The different objects detected with their score are listed below-
| human | 0.74903154 |
| human | 0.7123633 |
| laptop | 0.69287986 |
| human | 0.68936586 |
| bottle | 0.67716646 |
| human | 0.66410005 |
| human | 0.5968385 |
| chair | 0.5855772 |
| human | 0.5802317 |
| bottle | 0.5792091 |
| chair | 0.5783555 |
| chair | 0.538948 |
| human | 0.52267283 |
Next, we will be interested in working on a model good in detecting objects in the larger depth of the image, which the current ResNet50-FPN could not do.
About author: Harsh Vardhan is a Tech Lead in the Development Department of Mantra Labs. He is integral to AI-based development and deployment of projects at Mantra Labs.
RetinaNet is a type of CNN (Convolutional Neural Network) architecture published by Facebook AI Research also known as FAIR. It uses the Feature Pyramid Network (FPN) with ResNet. RetinaNet is widely used for detecting objects in live imagery (real-time monitoring systems). This architecture demonstrates a high-level of accuracy, but with a little compromise in speed. In the experiment we conducted, it took 5-7 seconds for object detection in live scenes.
RetinaNet model comprises of a backbone network and two task-specific sub-networks. The backbone network is a Feature Pyramid Network (FPN) built on ResNet. It is responsible for computing a convolution feature (object) from the input imagery. The two subnetworks are responsible for the classification and box regression, i.e. one subnet predicts the possibility of the object being present at a particular spatial location and the other subnetwork outputs the object location for the anchor box.
The focal loss function focuses on training on hard negatives. In other words, the focal loss function is an algorithm for improving Average Precision (AP) in single-stage object detectors. It is defined as-
Single Shot Detector (SSD) can detect multiple objects in an image in a single shot, hence the name.
The beauty of SSD networks is that it predicts the boundaries itself and has no assigned region proposal network. SSD networks can predict the boundary boxes and classes from feature maps in just one pass by using small convolutional filters.
Deep Learning uses Convolutional neural networks (CNN) for analyzing visual imagery. It consists of an input and output layer and multiple intermediate layers. In CNN programming, the input is called a tensor, which is usually an image or a video frame. It passes through the convolutional layer forming an abstract feature map identifying different shapes.
The process of combining region proposals with CNN is called as R-CNN. Region proposals are the smaller parts of the original image that have a probability of containing the desired shape/object. The R-CNN algorithm creates several region proposals and each of them goes to the CNN network for better dense shape detection.
Residual Neural Network (ResNet) utilizes skip connections to jump over some layers. Classical CNNs do not perform when the depth of the network increases beyond a certain threshold. Most of the ResNet models are implemented with double or triple layer skips with batch normalization in between. ResNet helps in the training of deeper networks.
You only look once (YOLO) is a real-time object detection system. It is faster than most other neural networks for detecting shapes and objects. Unlike other systems, it applies neural network functions to the entire image, optimizing the detection performance.
It is Facebook’s AI Research arm for understanding the nature of intelligence and creating intelligent machines. The main research areas at FAIR include Computer Vision, Conversational AI, Integrity, Natural Language Processing, Ranking and Recommendations, System Research, Theory, Speech & Audio, and Human & Machine Intelligence.
Feature Pyramid Network (FPN) is a feature extractor designed for achieving speed and accuracy in detecting objects or shapes. It generates multiple feature map layers with better quality information for object detection.
Common Objects in Context (COCO) is a large-scale dataset for detecting, segmenting, and captioning any object.
Fully Convolutional Network (FCN) transforms the height and width of the intermediate layer (feature map) back to the original size so that predictions have a one-to-one correspondence with the input image.
R-FCN corresponds to a region-based fully convolutional network. It is mainly used for feature detection. R-FCN comprises region-based feature maps that are independent of region proposals (ROI) and carry computation outside of ROIs. It is much simpler and about 20 times faster than R-CNN.
It is an open-source software library developed by Google Brain for a range of dataflow and differential programming applications. It is also useful in neural network programming.
Also read – How are Medical Images shared among Healthcare Enterprises
Knowledge thats worth delivered in your inbox
Smart Manufacturing starts with real-time visibility.
Manufacturing companies today generate data by the second through sensors, machines, ERP systems, and MES platforms. But without real-time insights, even the most advanced production lines are essentially flying blind.
Manufacturers are implementing real-time dashboards that serve as control towers for their daily operations, enabling them to shift from reactive to proactive decision-making. These tools are essential to the evolution of Smart Manufacturing, where connected systems, automation, and intelligent analytics come together to drive measurable impact.
Data is available, but what’s missing is timely action.
For many plant leaders and COOs, one challenge persists: operational data is dispersed throughout systems, delayed, or hidden in spreadsheets. And this delay turns into a liability.
Real-time dashboards help uncover critical answers:
By converting raw inputs into real-time manufacturing analytics, dashboards make operational intelligence accessible to operators, supervisors, and leadership alike, enabling teams to anticipate problems rather than react to them.
Line performance and downtime trends
Track OEE in real time and identify underperforming lines.
Predictive maintenance alerts
Utilize historical and sensor data to identify potential part failures in advance.
Inventory heat maps & reorder thresholds
Anticipate stockouts or overstocks based on dynamic reorder points.
Quality metrics linked to operator actions
Isolate shifts or procedures correlated with spikes in defects or rework.
These insights allow production teams to drive day-to-day operations in line with Smart Manufacturing principles.
Role-based dashboards
Dashboards can be configured for machine operators, shift supervisors, and plant managers, each with a tailored view of KPIs.
Embedded alerts and nudges
Real-time prompts, like “Line 4 below efficiency threshold for 15+ minutes,” reduce response times and minimize disruptions.
Cross-functional drill-downs
Teams can identify root causes more quickly because users can move from plant-wide overviews to detailed machine-level data in seconds.
Data lakehouse integration
Unified access to ERP, MES, IoT sensor, and QA systems—ensuring reliable and timely manufacturing analytics.
ETL pipelines
Real-time data ingestion from high-frequency sources with minimal latency.
Visualization tools
Custom builds using Power BI, or customized solutions designed for frontline usability and operational impact.
Mantra Labs partnered with a North American die-casting manufacturer to unify its operational data into a real-time dashboard. Fragmented data, manual reporting, delayed pricing decisions, and inconsistent data quality hindered operational efficiency and strategic decision-making.
As this case shows, real-time dashboards are not just operational tools—they’re strategic enablers.
(Learn More: Powering the Future of Metal Manufacturing with Data Engineering)
| Aspect | What You Should Know |
| 1. Why Static Reports Fall Short | Delayed insights after issues occur Disconnected systems (ERP, MES, sensors) No real-time alerts or embedded decision logic |
| 2. What Real-Time Dashboards Enable | Track OEE and downtime in real-time Predictive maintenance using sensor data Dynamic inventory heat maps Quality linked to operators |
| 3. Dashboards That Drive Action | Role-based views (operator to CEO) Embedded alerts like “Line 4 down for 15+ mins” Drilldowns from plant-level to machine-level |
| 4. What Powers These Dashboards | Unified Data Lakehouse (ERP + IoT + MES) Real-time ETL pipelines Power BI or custom dashboards built for frontline usability |
Smart Manufacturing dashboards aren’t just analytics tools—they’re productivity engines. Dashboards that deliver real-time insight empower frontline teams to make faster, better decisions—whether it’s adjusting production schedules, triggering preventive maintenance, or responding to inventory fluctuations.
Explore how Mantra Labs can help you unlock operations intelligence that’s actually usable.
Knowledge thats worth delivered in your inbox


Our Sales Team will be in touch with you shortly.

Hello Stranger! Please fill in a few details,and you’ll receive a link to this case study.
 We have mailed you this case study.
Thanks for subscribing.
