Try : Insurtech, Application Development

AgriTech(1)

Augmented Reality(21)

Clean Tech(9)

Customer Journey(17)

Design(45)

Solar Industry(8)

User Experience(68)

Edtech(10)

Events(34)

HR Tech(3)

Interviews(10)

Life@mantra(11)

Logistics(6)

Manufacturing(5)

Strategy(18)

Testing(9)

Android(48)

Backend(32)

Dev Ops(11)

Enterprise Solution(33)

Technology Modernization(9)

Frontend(29)

iOS(43)

Javascript(15)

AI in Insurance(41)

Insurtech(67)

Product Innovation(59)

Solutions(22)

E-health(12)

HealthTech(25)

mHealth(5)

Telehealth Care(4)

Telemedicine(5)

Artificial Intelligence(154)

Bitcoin(8)

Blockchain(19)

Cognitive Computing(8)

Computer Vision(8)

Data Science(24)

FinTech(51)

Banking(7)

Intelligent Automation(27)

Machine Learning(48)

Natural Language Processing(14)

expand Menu Filters

Essential Checklist for Web Optimization

In this competitive technological era, industries have bloomed in a way that we now have a vast array of options to pick from whether we need to shop online or use any services. Therefore, it becomes imperative for businesses to monitor users’ changing demands and keep a close watch on how well their website or app is performing. 

Web/app loading-related metrics:

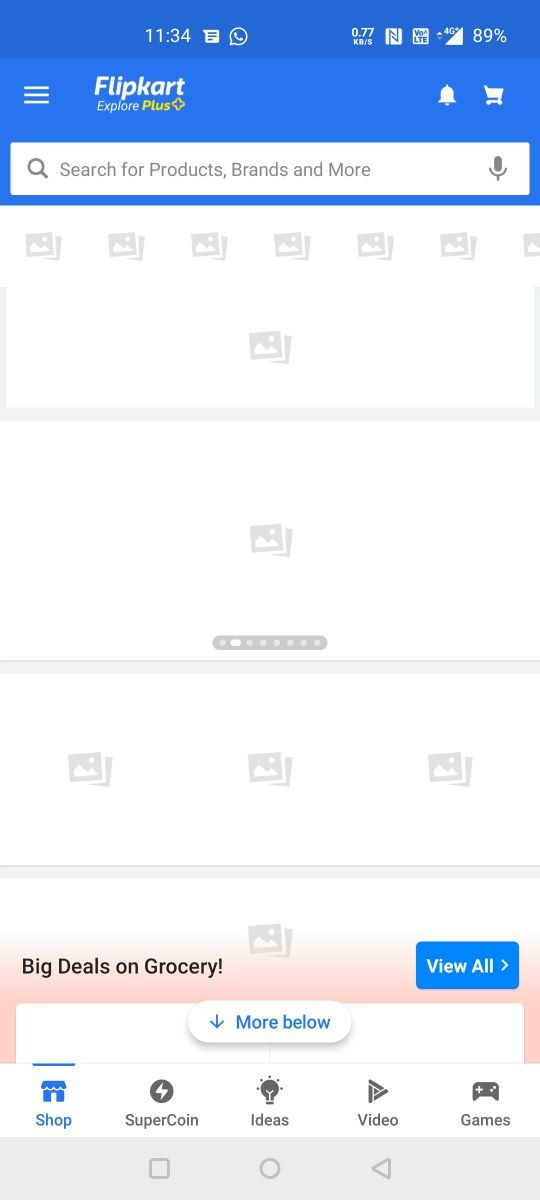
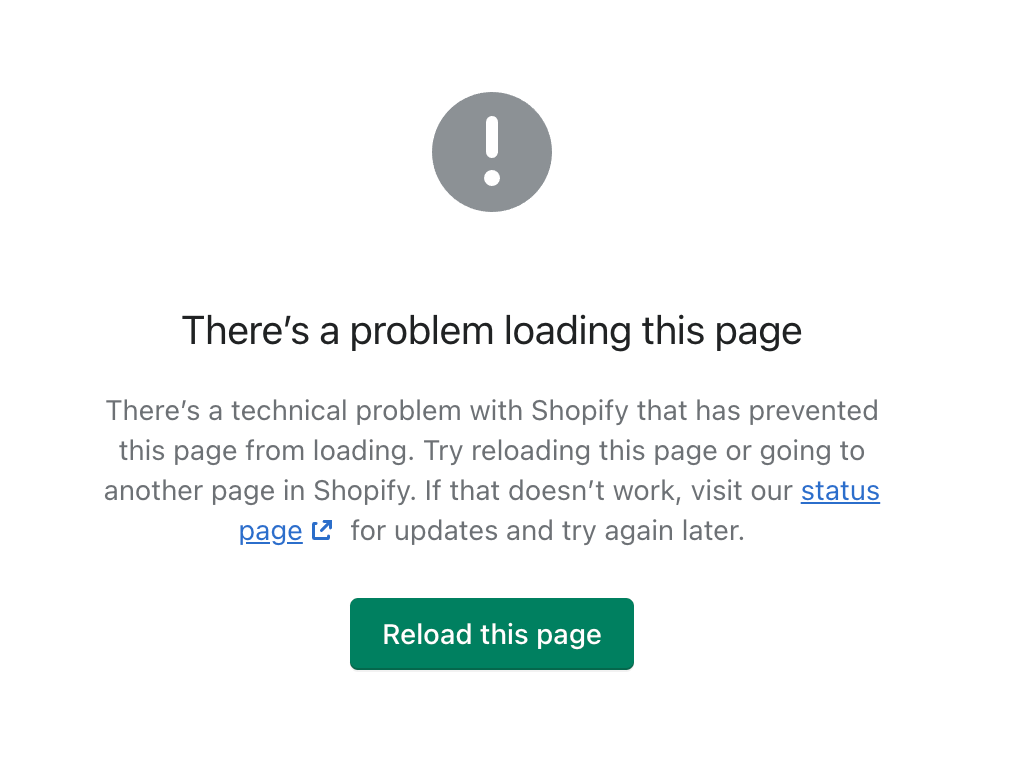
Imagine going to a website to avail of a service or to shop online, and the website struggles to load every time you select something, let’s say it’s more than 30 seconds. It disrupts the user’s seamless buying experience and eventually causes them to lose interest in just a few minutes. 

Search engines consider factors like page load time, responsiveness, mobile friendliness, etc. when ranking websites. It is necessary to do a complete website analysis and perform a site crawl to comprehend its structure, URL patterns, and template.

Here are a few vital parameters that can help you to do a self-check and understand how easy is your website/app to use for your customers and how you can optimize it for better results. 

Largest Colorful Paint (LCP):

LCP denotes a point when the website’s main content is likely loaded in the page load timeline, making it a crucial user-centric statistic for gauging perceived load speed. A fast LCP tells the user that the page is useful. LCP also indicates the render time of the largest picture or text block visible within the viewport. Sites with 2.5 seconds or less LCP have a good user experience. 

The site has opened but images are not displayed – Bad LCP performance

 Website failed to load and crashes

First Contentful Paint (FCP) – 

FCP is the time taken by the app or website to load the largest and first contentful page. It calculates the duration from when the page begins to load to the time when any page’s content is displayed on the screen.

For this metric, “content” refers to text, images (including background images), <svg> elements, or non-white <canvas> elements.

FCP TimeColor Coding 
0-1.8Green(Fast)
1.8 – 3Yellow (Moderate)
Over 3Red (Slow)

Total Blocking Time (TBT) – The time interval between FCP and TTI 

TBT calculates the total period of time that a website has been blocked from responding to user input. When a task takes more than 50 milliseconds (ms) (which is known as long task) to complete on the main thread, the main thread gets blocked and the browser cannot stop an ongoing task. Therefore, if a user does interact with the page in the middle of a long task, the browser will have to wait until the task is finished before responding. The user is likely to notice the delay and consider the page to be unresponsive. Ex: When a video ad pops up.

Total Time to Interactive (TTI) – Time taken by the website/app to get ready to collect inputs from the user (Username, password, etc).

TTI estimates the amount of time it takes for a page to load from the time it first loads until its primary sub-resources have loaded.

Techniques like server-side rendering (SSR) may result in situations where a page appears interactive (that is, links and buttons are visible on the screen) but it’s not interactive as the main thread is blocked or the JavaScript code controlling those elements hasn’t been loaded.

Cumulative Layout Shift (CLS) 

A webpage’s CLS tells you how much it suddenly shifts throughout the course of its existence. A high CLS score is achieved if a website visitor viewed a page and, as they were reading it, the banner loads and the page jumps down.

CLS is a component of Google’s Core Web Vitals, along with Largest Contentful Paint and First Input Delay (how long it takes for a website to be interactive or “clickable”). Each page that Google web crawlers index has a CLS measurement.

Tips to optimize your website’s load time:

  • Anticipate your user traffic

Predict when there might be a spike and how much can be the maximum traffic you can expect – for instance, days like sales, special offers, etc.

  • Understand and study the Consumer behavior 

Narrow down and find out what are the user patterns – peak traffic achieved during which time intervals, which is the most visited section, and how much time a user spends on the website or app. Ensure the most visited sections perform well always and be extra cautious during peak times.

  • Ask and ask always

 Product/ Service feedback is pivotal when planning where to optimize and how to achieve the best results for user engagement, satisfaction, and retention. Surveys are an evergreen and classic way to do a self-assessment.

  • Keep track and scale up when needed

Track the above-mentioned data from time to time, document it, and do a detailed data analysis. Do a regular check and scale up as your user base increases. Remember, the performance of a website might be good for thousands of users but might need to improve when the user base expands to a lakh.

  • Competitive Analysis

Take inspiration from competitors in your field. Study how many users they have, how seamless their site features are, and how time efficient they are.

  • Introduce new features to save the users time like image optimization, and optimizing your Javascript codes which will help you to improve the user experience.

To engage your users for a longer time, always save their time and effort :) 

We’ll discuss web optimization techniques in the next blog. Stay Tuned!

Further reading: Why Web Optimization is a Must for Businesses?

Cancel

Knowledge thats worth delivered in your inbox

Smart Manufacturing Dashboards: A Real-Time Guide for Data-Driven Ops

Smart Manufacturing starts with real-time visibility.

Manufacturing companies today generate data by the second through sensors, machines, ERP systems, and MES platforms. But without real-time insights, even the most advanced production lines are essentially flying blind.

Manufacturers are implementing real-time dashboards that serve as control towers for their daily operations, enabling them to shift from reactive to proactive decision-making. These tools are essential to the evolution of Smart Manufacturing, where connected systems, automation, and intelligent analytics come together to drive measurable impact.

Data is available, but what’s missing is timely action.

For many plant leaders and COOs, one challenge persists: operational data is dispersed throughout systems, delayed, or hidden in spreadsheets. And this delay turns into a liability.

Real-time dashboards help uncover critical answers:

  • What caused downtime during last night’s shift?
  • Was there a delay in maintenance response?
  • Did a specific inventory threshold trigger a quality issue?

By converting raw inputs into real-time manufacturing analytics, dashboards make operational intelligence accessible to operators, supervisors, and leadership alike, enabling teams to anticipate problems rather than react to them.

1. Why Static Reports Fall Short

  • Reports often arrive late—after downtime, delays, or defects have occurred.
  • Disconnected data across ERP, MES, and sensors limits cross-functional insights.
  • Static formats lack embedded logic for proactive decision support.

2. What Real-Time Dashboards Enable

Line performance and downtime trends
Track OEE in real time and identify underperforming lines.

Predictive maintenance alerts
Utilize historical and sensor data to identify potential part failures in advance.

Inventory heat maps & reorder thresholds
Anticipate stockouts or overstocks based on dynamic reorder points.

Quality metrics linked to operator actions
Isolate shifts or procedures correlated with spikes in defects or rework.

These insights allow production teams to drive day-to-day operations in line with Smart Manufacturing principles.

3. Dashboards That Drive Action

Role-based dashboards
Dashboards can be configured for machine operators, shift supervisors, and plant managers, each with a tailored view of KPIs.

Embedded alerts and nudges
Real-time prompts, like “Line 4 below efficiency threshold for 15+ minutes,” reduce response times and minimize disruptions.

Cross-functional drill-downs
Teams can identify root causes more quickly because users can move from plant-wide overviews to detailed machine-level data in seconds.

4. What Powers These Dashboards

Data lakehouse integration
Unified access to ERP, MES, IoT sensor, and QA systems—ensuring reliable and timely manufacturing analytics.

ETL pipelines
Real-time data ingestion from high-frequency sources with minimal latency.

Visualization tools
Custom builds using Power BI, or customized solutions designed for frontline usability and operational impact.

Smart Manufacturing in Action: Reducing Market Response Time from 48 Hours to 30 Minutes

Mantra Labs partnered with a North American die-casting manufacturer to unify its operational data into a real-time dashboard. Fragmented data, manual reporting, delayed pricing decisions, and inconsistent data quality hindered operational efficiency and strategic decision-making.

Tech Enablement:

  • Centralized Data Hub with real-time access to critical business insights.
  • Automated report generation with data ingestion and processing.
  • Accurate price modeling with real-time visibility into metal price trends, cost impacts, and customer-specific pricing scenarios. 
  • Proactive market analysis with intuitive Power BI dashboards and reports.

Business Outcomes:

  • Faster response to machine alerts
  • Quality incidents traced to specific operator workflows
  • 4X faster access to insights led to improved inventory optimization.

As this case shows, real-time dashboards are not just operational tools—they’re strategic enablers. 

(Learn More: Powering the Future of Metal Manufacturing with Data Engineering)

Key Takeaways: Smart Manufacturing Dashboards at a Glance

AspectWhat You Should Know
1. Why Static Reports Fall ShortDelayed insights after issues occur
Disconnected systems (ERP, MES, sensors)
No real-time alerts or embedded decision logic
2. What Real-Time Dashboards EnableTrack OEE and downtime in real-time
Predictive maintenance using sensor data
Dynamic inventory heat maps
Quality linked to operators
3. Dashboards That Drive ActionRole-based views (operator to CEO)
Embedded alerts like “Line 4 down for 15+ mins”
Drilldowns from plant-level to machine-level
4. What Powers These DashboardsUnified Data Lakehouse (ERP + IoT + MES)
Real-time ETL pipelines
Power BI or custom dashboards built for frontline usability

Conclusion

Smart Manufacturing dashboards aren’t just analytics tools—they’re productivity engines. Dashboards that deliver real-time insight empower frontline teams to make faster, better decisions—whether it’s adjusting production schedules, triggering preventive maintenance, or responding to inventory fluctuations.

Explore how Mantra Labs can help you unlock operations intelligence that’s actually usable.

Cancel

Knowledge thats worth delivered in your inbox

Loading More Posts ...
Go Top
ml floating chatbot