


Published on Aug 2, 2019
Updated on Oct 16, 2019
Create superior customer experiences to enhance competitive advantage.
Go from zero to breakthrough with scalable, future-proof solutions.
Harness deep tech for smarter solutions and maximum impact.
Accelerate value delivery with powerful pre-built digital tools.
Help businesses connect with an internet first generation.
Test the smarter way: where precision meets efficiency.
Unlock real-time and personalized customer journeys for mobile first generation.
Turn data into decisive action with scalable AI infrastructure.
Design agile digital foundations that scale with tomorrow's business needs.
Build new-age architecture for maximum efficiency and hyper-growth.
Fine-tune your cloud infrastructure for peak performance.
Automated compliance and control for global regulations.

All
Customer Experience
Mantra
Application Development
Insurtech
Digital Health
Insurance
Deep-Tech
AgriTech(1)
Augmented Reality(21)
Clean Tech(9)
Customer Journey(17)
Design(45)
Solar Industry(8)
User Experience(68)
Edtech(10)
Events(34)
HR Tech(3)
Interviews(10)
Life@mantra(11)
Logistics(6)
Manufacturing(5)
Strategy(18)
Testing(9)
Android(48)
Backend(32)
Dev Ops(11)
Enterprise Solution(33)
Technology Modernization(9)
Frontend(29)
iOS(43)
Javascript(15)
AI in Insurance(41)
Insurtech(67)
Product Innovation(59)
Solutions(22)
E-health(12)
HealthTech(25)
mHealth(5)
Telehealth Care(4)
Telemedicine(5)
Artificial Intelligence(154)
Bitcoin(8)
Blockchain(19)
Cognitive Computing(8)
Computer Vision(8)
Data Science(24)
FinTech(51)
Banking(7)
Intelligent Automation(27)
Machine Learning(48)
Natural Language Processing(14)
For any operational effort across large organizations, a significant amount of time and resources are spent manually inputting data into downstream systems. These processes more specifically affect insurance practices that are deeply reliant on back-office processes. The bulk of the insurance workforce is condensed into operations and support functions (e.g. policy issuance and servicing). Here, data is typically unstructured and locked away in heaps of paper-based documents, emails, scanned images, excel worksheets, pdf, and word reports.
Typically in insurance, at least 90% of unstructured documents are manually processed, while an ‘Insurance Policy Administration System’ is on average between 15–20 years old — forcing them at times to lag behind their financial services peers.
To make the most out of the massive quanta of inbound data stored in siloed systems, firms have recently begun to take a serious look at streamlining data migration using AI-based tools. The burgeoning reality is that a tremendous amount of man-hours are wasted in repetitive tasks leading to increased processing times and slower through rates for insurance.
Proportion of Unstructured Data in P&C Insurance (%)
Source: SPS Data
AI Gets Holed Up In Silos
According to a recent IDG study titled the ‘Future of Work’, less than 50% of global enterprises have deployed intelligent automation technologies (such as AI, Cognitive Automation or RPA), while over two-thirds find greater difficulty in integrating these people, process and AI. Over fifty percent of enterprises identify siloed deployments and overwhelmed internal application development teams as long-term issues. This can create friction between teams operating in silos and those trying to derive insights from unstructured docs. Nearly a third of enterprises identified getting AI into production and live services as the single biggest challenge to overcome.
According to a McKinsey paper, intelligent process automation is at the core of next-generation operational business models.
The Need For Intelligent Document Processing
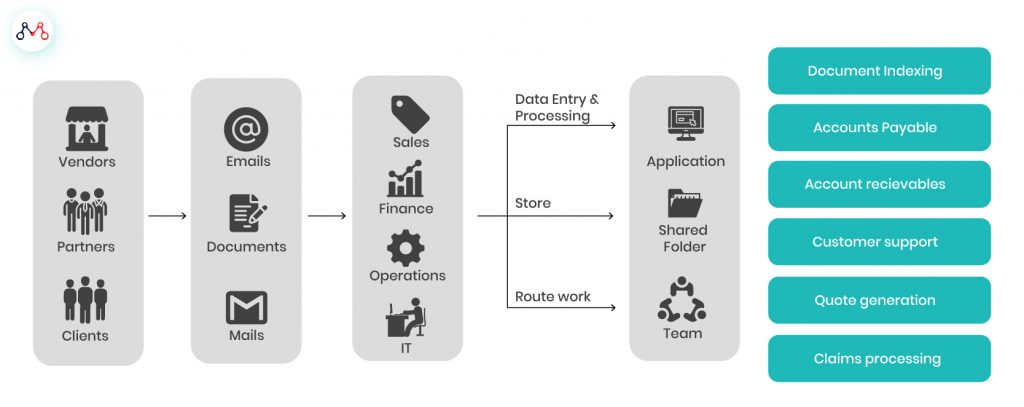
Source: Imaginea
A New Platform
MantraLabs has launched a unique solution to address the insurer’s pain-point through an intelligent platform built especially for silos, The solution addresses several dependency issues and is built to scale, making it a vendor-neutral platform that doesn’t require deep coding skills. The christened solution is FlowMagic — a simple and easy to use visual AI platform for insurer workflows.
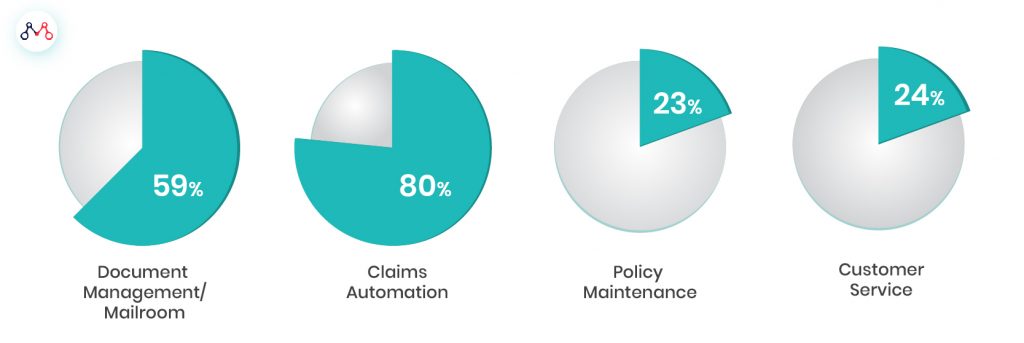
FlowMagic applies proprietary AI techniques, Machine Learning and NLP, to extract any target data from unstructured documents. At the recently convened 4th Annual Insurance India Summit and Awards 2019 held in Mumbai, Mantra Labs presented a live demonstration of FlowMagic’s unique capabilities. Mantra Labs CEO Parag Sharma took the opportunity while speaking in front of industry leaders and attendees, to showcase our true AI-first approach to solving insurance challenges. FlowMagic truly embodies the spirit of that approach in tackling the problems plaguing traditional insurers — such as reducing document delivery times to the back-office by 80%.
FLOWMAGIC DASHBOARD

Customizable Workflows
The platform is equipped with plug and play capability. Using quick drag and drop, one can create custom workflows to address the most pressing operational functions, such as insurance agent onboarding or verifying medical invoices. Mantra Labs has pre-built over 50 AI-powered apps for its users to take advantage of. The open platform also allows insurers to create their own apps that can be seamlessly integrated.

FLOW MAGIC’s IN-BUILT APPS
By leveraging machine learning, insurers can use FlowMagic to shift intensive operational functions into auto-pilot. The AI tool can automate the ‘classify, extract, and validate’ cycle for insurers and direct decision-ready insights straight to decision-makers.
Although declining, the Insurance field is still paper-intensive. Insurers are shifting towards AI-powered engines to replace unnecessary manned effort behind redundant operational tasks. These systems can bring about at least a 70% reduction in manual processing and 30% improvement in cost-efficiencies throughout the value chain.
To know more about how FlowMagic is helping insurance leaders cognitively automate complex processes, reach out to us at hello@mantralabsglobal.com
Knowledge thats worth delivered in your inbox
Smart Manufacturing starts with real-time visibility.
Manufacturing companies today generate data by the second through sensors, machines, ERP systems, and MES platforms. But without real-time insights, even the most advanced production lines are essentially flying blind.
Manufacturers are implementing real-time dashboards that serve as control towers for their daily operations, enabling them to shift from reactive to proactive decision-making. These tools are essential to the evolution of Smart Manufacturing, where connected systems, automation, and intelligent analytics come together to drive measurable impact.
Data is available, but what’s missing is timely action.
For many plant leaders and COOs, one challenge persists: operational data is dispersed throughout systems, delayed, or hidden in spreadsheets. And this delay turns into a liability.
Real-time dashboards help uncover critical answers:
By converting raw inputs into real-time manufacturing analytics, dashboards make operational intelligence accessible to operators, supervisors, and leadership alike, enabling teams to anticipate problems rather than react to them.
Line performance and downtime trends
Track OEE in real time and identify underperforming lines.
Predictive maintenance alerts
Utilize historical and sensor data to identify potential part failures in advance.
Inventory heat maps & reorder thresholds
Anticipate stockouts or overstocks based on dynamic reorder points.
Quality metrics linked to operator actions
Isolate shifts or procedures correlated with spikes in defects or rework.
These insights allow production teams to drive day-to-day operations in line with Smart Manufacturing principles.
Role-based dashboards
Dashboards can be configured for machine operators, shift supervisors, and plant managers, each with a tailored view of KPIs.
Embedded alerts and nudges
Real-time prompts, like “Line 4 below efficiency threshold for 15+ minutes,” reduce response times and minimize disruptions.
Cross-functional drill-downs
Teams can identify root causes more quickly because users can move from plant-wide overviews to detailed machine-level data in seconds.
Data lakehouse integration
Unified access to ERP, MES, IoT sensor, and QA systems—ensuring reliable and timely manufacturing analytics.
ETL pipelines
Real-time data ingestion from high-frequency sources with minimal latency.
Visualization tools
Custom builds using Power BI, or customized solutions designed for frontline usability and operational impact.
Mantra Labs partnered with a North American die-casting manufacturer to unify its operational data into a real-time dashboard. Fragmented data, manual reporting, delayed pricing decisions, and inconsistent data quality hindered operational efficiency and strategic decision-making.
As this case shows, real-time dashboards are not just operational tools—they’re strategic enablers.
(Learn More: Powering the Future of Metal Manufacturing with Data Engineering)
| Aspect | What You Should Know |
| 1. Why Static Reports Fall Short | Delayed insights after issues occur Disconnected systems (ERP, MES, sensors) No real-time alerts or embedded decision logic |
| 2. What Real-Time Dashboards Enable | Track OEE and downtime in real-time Predictive maintenance using sensor data Dynamic inventory heat maps Quality linked to operators |
| 3. Dashboards That Drive Action | Role-based views (operator to CEO) Embedded alerts like “Line 4 down for 15+ mins” Drilldowns from plant-level to machine-level |
| 4. What Powers These Dashboards | Unified Data Lakehouse (ERP + IoT + MES) Real-time ETL pipelines Power BI or custom dashboards built for frontline usability |
Smart Manufacturing dashboards aren’t just analytics tools—they’re productivity engines. Dashboards that deliver real-time insight empower frontline teams to make faster, better decisions—whether it’s adjusting production schedules, triggering preventive maintenance, or responding to inventory fluctuations.
Explore how Mantra Labs can help you unlock operations intelligence that’s actually usable.
Knowledge thats worth delivered in your inbox


Our Sales Team will be in touch with you shortly.

Hello Stranger! Please fill in a few details,and you’ll receive a link to this case study.
 We have mailed you this case study.
Thanks for subscribing.
