


3 minutes, 49 seconds read
Published on Jan 9, 2020
Updated on May 11, 2020
Create superior customer experiences to enhance competitive advantage.
Go from zero to breakthrough with scalable, future-proof solutions.
Harness deep tech for smarter solutions and maximum impact.
Accelerate value delivery with powerful pre-built digital tools.
Help businesses connect with an internet first generation.
Test the smarter way: where precision meets efficiency.
Unlock real-time and personalized customer journeys for mobile first generation.
Turn data into decisive action with scalable AI infrastructure.
Design agile digital foundations that scale with tomorrow's business needs.
Build new-age architecture for maximum efficiency and hyper-growth.
Fine-tune your cloud infrastructure for peak performance.
Automated compliance and control for global regulations.

All
Customer Experience
Mantra
Application Development
Insurtech
Digital Health
Insurance
Deep-Tech
AgriTech(1)
Augmented Reality(21)
Clean Tech(9)
Customer Journey(17)
Design(45)
Solar Industry(8)
User Experience(68)
Edtech(10)
Events(34)
HR Tech(3)
Interviews(10)
Life@mantra(11)
Logistics(6)
Manufacturing(5)
Strategy(18)
Testing(9)
Android(48)
Backend(32)
Dev Ops(11)
Enterprise Solution(33)
Technology Modernization(9)
Frontend(29)
iOS(43)
Javascript(15)
AI in Insurance(41)
Insurtech(67)
Product Innovation(59)
Solutions(22)
E-health(12)
HealthTech(25)
mHealth(5)
Telehealth Care(4)
Telemedicine(5)
Artificial Intelligence(154)
Bitcoin(8)
Blockchain(19)
Cognitive Computing(8)
Computer Vision(8)
Data Science(24)
FinTech(51)
Banking(7)
Intelligent Automation(27)
Machine Learning(48)
Natural Language Processing(14)
The motor insurance market in India is approximately Rs 70,000 crore in terms of Gross Written Premiums. With newer and stricter regulations more and more people are buying motor insurance. However, while motor insurance, in general, has grown by 16% over the last year, the new digital insurers in the marketplace have seen their premiums increase by 4X-6X.
This underlines a shift in the way customers choose to buy motor insurance – from the convenience of their smartphone or computer, instantly. There is no reason to think that they would not want to settle an insurance claim in the same convenient manner. Fortunately, machine vision technology solves claims settlement challenges to a great extent.
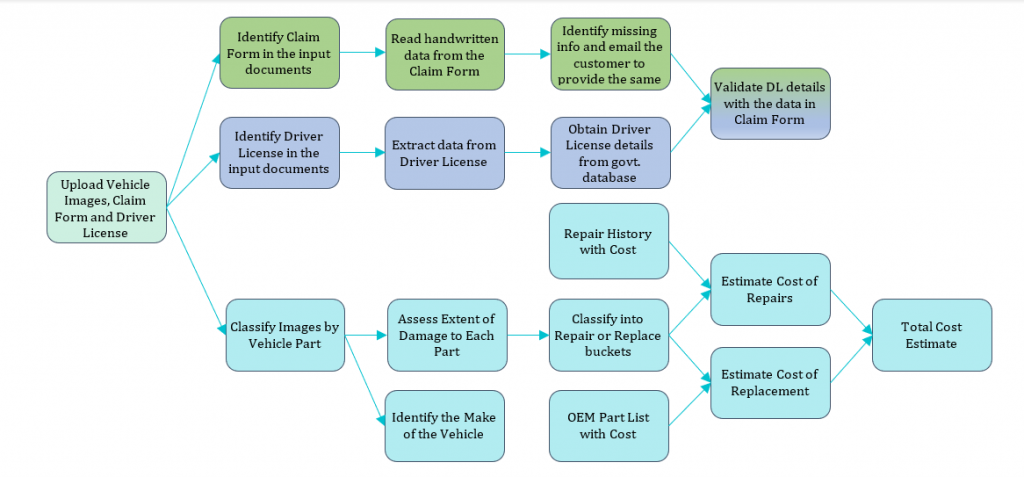
Let us have a quick look at the current claim settlement process for motor insurance. Once the accident occurs, the insured has to follow the following steps:
The above process is not only time consuming and stressful for the insured but also expensive for the insurer due to physical inspection and other manual checks and balances. The higher cost of processing the claim makes business less profitable to the insurer. The inconvenience and long wait make the product less desirable to the customer.
As more and more people buy motor insurance online, the customer expectation from the claim settlement process is changing as well. Customers now expect a seamless digital claim settlement process preferably in a matter of hours if not minutes, instead of the present industry standard of several days.
We at FlowMagic set out to solve this problem both for the insured and insurer using the power of artificial intelligence. We have used machine vision to eliminate the need for the surveyor in all but the most complex cases.
Using machine vision, we can process a car image and identify not only the damaged parts but also the severity of damage to those parts and whether it requires repair or a replacement. We have further analyzed repair cost data and images from tens of thousands of accident cases to build an Artificial Intelligence Costing Model that can estimate the cost of repairing any part just by looking at its photograph. All this means that the insurer doesn’t need the surveyor and other manual checks in most cases and the customer can submit a claim from the convenience of his smartphone and get an approval decision within minutes.
All the stakeholders in the insurance value chain can use our solution and benefit from it.
Insurance Company: By integrating this solution with mobile applications, Insurance companies can get quick claims intimations and a reasonable estimate of the repair cost. The damage severity analysis also helps the insurance company negotiate with the garage on whether a part needs repair or replacement.
Service Center or Garage: Multi-brand garages or service centers can quickly assess the level of damage to any car brought to them through machine vision-based FlowMagic. Accordingly, they can send a quick quotation to the insurance companies. The insurance companies can trust this quotation as it is generated by a robust AI model.
End Customer: An end customer can also use our free mobile application to get a repair estimate. This can be a starting point for an informed negotiation with a garage.
To learn more about how FlowMagic can transform the way you settle your motor insurance claims or discuss your broader AI goals, please get in touch with us at hello@mantralabsglobal.com
Also read – How AI can settle insurance claims in less than 5 minutes!
About author: Himanshu Saraf is a Capital Markets Director at Mantra Labs. He also leads Artificial Intelligence (AI) and Machine Learning initiatives in the company.
Knowledge thats worth delivered in your inbox
Smart Manufacturing starts with real-time visibility.
Manufacturing companies today generate data by the second through sensors, machines, ERP systems, and MES platforms. But without real-time insights, even the most advanced production lines are essentially flying blind.
Manufacturers are implementing real-time dashboards that serve as control towers for their daily operations, enabling them to shift from reactive to proactive decision-making. These tools are essential to the evolution of Smart Manufacturing, where connected systems, automation, and intelligent analytics come together to drive measurable impact.
Data is available, but what’s missing is timely action.
For many plant leaders and COOs, one challenge persists: operational data is dispersed throughout systems, delayed, or hidden in spreadsheets. And this delay turns into a liability.
Real-time dashboards help uncover critical answers:
By converting raw inputs into real-time manufacturing analytics, dashboards make operational intelligence accessible to operators, supervisors, and leadership alike, enabling teams to anticipate problems rather than react to them.
Line performance and downtime trends
Track OEE in real time and identify underperforming lines.
Predictive maintenance alerts
Utilize historical and sensor data to identify potential part failures in advance.
Inventory heat maps & reorder thresholds
Anticipate stockouts or overstocks based on dynamic reorder points.
Quality metrics linked to operator actions
Isolate shifts or procedures correlated with spikes in defects or rework.
These insights allow production teams to drive day-to-day operations in line with Smart Manufacturing principles.
Role-based dashboards
Dashboards can be configured for machine operators, shift supervisors, and plant managers, each with a tailored view of KPIs.
Embedded alerts and nudges
Real-time prompts, like “Line 4 below efficiency threshold for 15+ minutes,” reduce response times and minimize disruptions.
Cross-functional drill-downs
Teams can identify root causes more quickly because users can move from plant-wide overviews to detailed machine-level data in seconds.
Data lakehouse integration
Unified access to ERP, MES, IoT sensor, and QA systems—ensuring reliable and timely manufacturing analytics.
ETL pipelines
Real-time data ingestion from high-frequency sources with minimal latency.
Visualization tools
Custom builds using Power BI, or customized solutions designed for frontline usability and operational impact.
Mantra Labs partnered with a North American die-casting manufacturer to unify its operational data into a real-time dashboard. Fragmented data, manual reporting, delayed pricing decisions, and inconsistent data quality hindered operational efficiency and strategic decision-making.
As this case shows, real-time dashboards are not just operational tools—they’re strategic enablers.
(Learn More: Powering the Future of Metal Manufacturing with Data Engineering)
| Aspect | What You Should Know |
| 1. Why Static Reports Fall Short | Delayed insights after issues occur Disconnected systems (ERP, MES, sensors) No real-time alerts or embedded decision logic |
| 2. What Real-Time Dashboards Enable | Track OEE and downtime in real-time Predictive maintenance using sensor data Dynamic inventory heat maps Quality linked to operators |
| 3. Dashboards That Drive Action | Role-based views (operator to CEO) Embedded alerts like “Line 4 down for 15+ mins” Drilldowns from plant-level to machine-level |
| 4. What Powers These Dashboards | Unified Data Lakehouse (ERP + IoT + MES) Real-time ETL pipelines Power BI or custom dashboards built for frontline usability |
Smart Manufacturing dashboards aren’t just analytics tools—they’re productivity engines. Dashboards that deliver real-time insight empower frontline teams to make faster, better decisions—whether it’s adjusting production schedules, triggering preventive maintenance, or responding to inventory fluctuations.
Explore how Mantra Labs can help you unlock operations intelligence that’s actually usable.
Knowledge thats worth delivered in your inbox


Our Sales Team will be in touch with you shortly.

Hello Stranger! Please fill in a few details,and you’ll receive a link to this case study.
 We have mailed you this case study.
Thanks for subscribing.
