


4 minutes, 23 seconds read
Published on Nov 26, 2019
Updated on Dec 18, 2019
Create superior customer experiences to enhance competitive advantage.
Go from zero to breakthrough with scalable, future-proof solutions.
Harness deep tech for smarter solutions and maximum impact.
Accelerate value delivery with powerful pre-built digital tools.
Help businesses connect with an internet first generation.
Test the smarter way: where precision meets efficiency.
Unlock real-time and personalized customer journeys for mobile first generation.
Turn data into decisive action with scalable AI infrastructure.
Design agile digital foundations that scale with tomorrow's business needs.
Build new-age architecture for maximum efficiency and hyper-growth.
Fine-tune your cloud infrastructure for peak performance.
Automated compliance and control for global regulations.

All
Customer Experience
Mantra
Application Development
Insurtech
Digital Health
Insurance
Deep-Tech
AgriTech(1)
Augmented Reality(21)
Clean Tech(9)
Customer Journey(17)
Design(45)
Solar Industry(8)
User Experience(68)
Edtech(10)
Events(34)
HR Tech(3)
Interviews(10)
Life@mantra(11)
Logistics(6)
Manufacturing(5)
Strategy(18)
Testing(9)
Android(48)
Backend(32)
Dev Ops(11)
Enterprise Solution(33)
Technology Modernization(9)
Frontend(29)
iOS(43)
Javascript(15)
AI in Insurance(41)
Insurtech(67)
Product Innovation(59)
Solutions(22)
E-health(12)
HealthTech(25)
mHealth(5)
Telehealth Care(4)
Telemedicine(5)
Artificial Intelligence(154)
Bitcoin(8)
Blockchain(19)
Cognitive Computing(8)
Computer Vision(8)
Data Science(24)
FinTech(51)
Banking(7)
Intelligent Automation(27)
Machine Learning(48)
Natural Language Processing(14)
Website performance optimization or simply, website optimization is a process of improving a website’s loading speed in the browser. It generally involves editing the website to optimize scripts, HTML, or CSS code and reducing the number of web page components like images, scripts, or video for faster loading.
Web performance is the speed in which web pages are loaded and displayed on the user’s web browser.
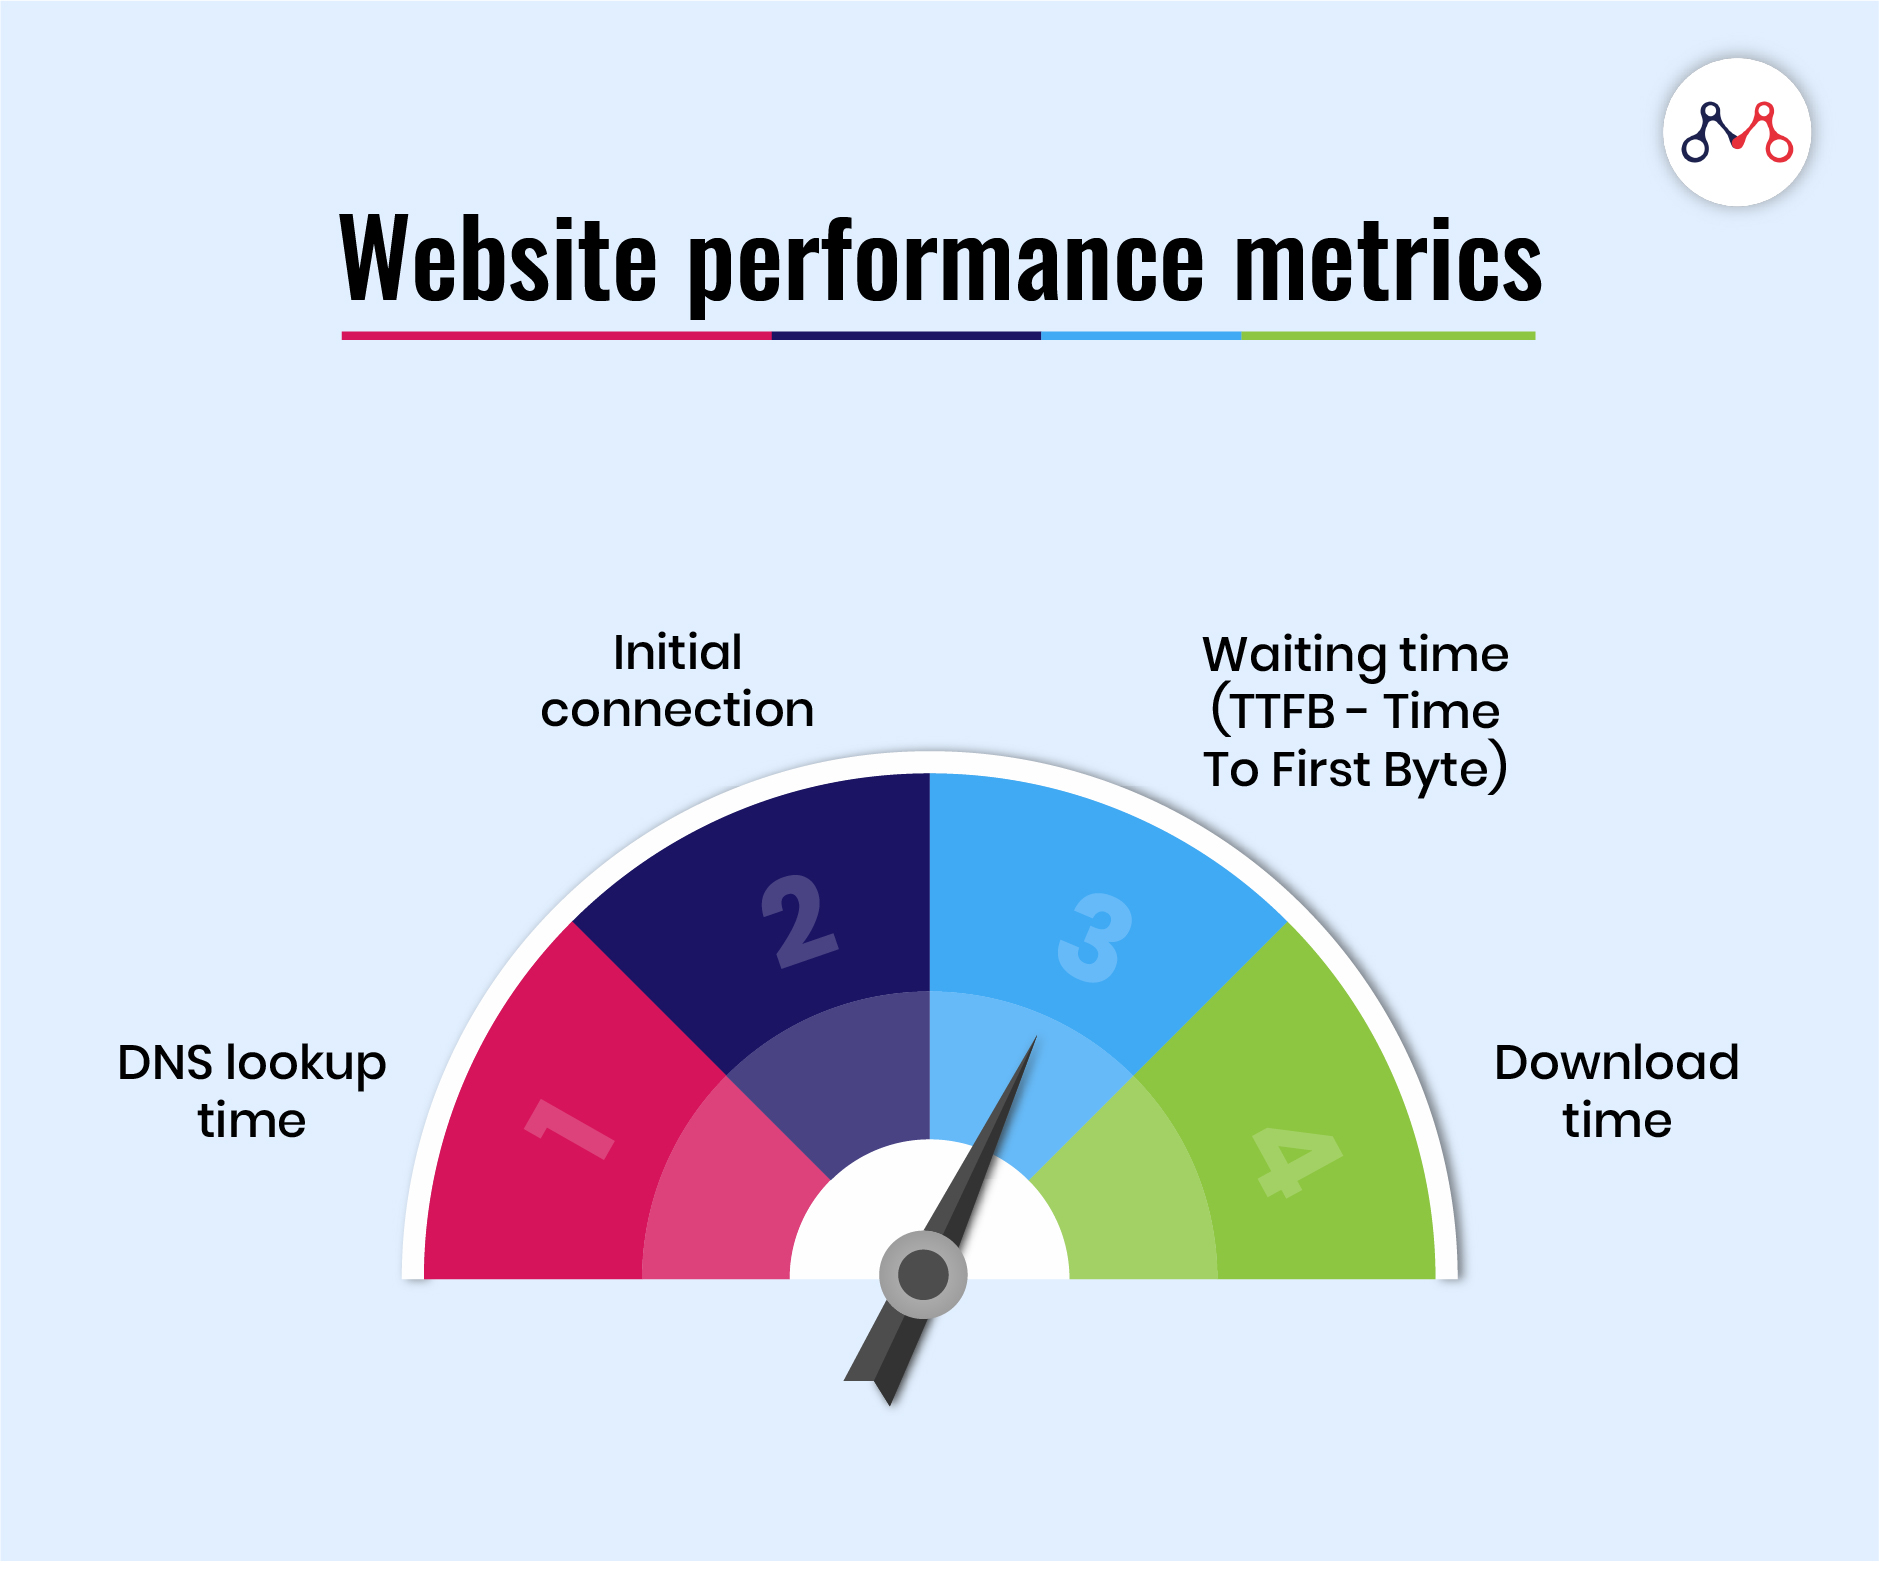
The following are the website performance metrics-
The Domain Name System (DNS) is the phonebook of the Internet. Users access online information through domain names, like www.mantralabsglobal.com. Web browsers interact through Internet Protocol (IP) addresses. DNS translates domain names to IP addresses so that browsers can load Internet resources.
It is the time for a handshake between the browser and the server to retrieve the contents of the page. Handshaking is a process by which two devices initiate communications (here- browser and server). It initiates with the browser sending a message to the server indicating that it wants to establish a connection.
It is the time spent waiting for the initial response, also known as the Time To First Byte. This time captures the latency (the delay between the instruction and data transfer) of a round trip to the server. It also accounts the time spent waiting for the server’s response.
It is the time spent receiving the response data.
You’ll need to consider the following to enhance a website’s performance.
Implement the following to reduce DNS lookup time-
It is a temporary storage location on a computer for files that a browser downloads to display websites. Locally cached files may include any documents from a website, such as HTML files, CSS style sheets, JavaScript scripts, graphic images, and other multimedia content. When a user revisits the website, the browser checks for the updated content and downloads only those files or what is not already present in the cache. This reduces bandwidth usage on both the user and server-side and loads the page faster.
It is a process of delivering high-quality images in the right format, dimension, size, and resolution while keeping the smallest possible size. There are different ways to optimize images. You can resize, cache, or compress the image size.
While moving the source of website production, minify the contents of source code (Uglify), to reduce the overall size of the page. It will enhance the download speed for the page content on the web browser.
Maintain the standard HTML hierarchy, which means- push all the render-blocking scripts to the bottom of the page and keep only required assets on the header part of the load content. This way, the user doesn’t have to wait to see the actual page because of render-blocking scripts.
Sprite images are the group of images, which are combined to create a single image for a web page. As the number of server requests affects the bandwidth and loses the page speed score, it is better to combine all the possible images into sprite images.
The web standards suggest GZIP compression. It is effective for optimum bandwidth utilization while rendering the contents. Let’s say- the overall size of the assets is 900KB. Enabling GZIP compression can compress the content size to at least 600KB. This enhances the bandwidth and pages render at a faster rate.
Prefer using secured channels to load the web page contents. It prevents the malware intro into the page.
Use a very less number of redirections in the websites. The introduction of too many redirections will consume the DNS lookup time and affect the page load time.
Use CDN paths for the static resources, which enhances the load time performance of the website. CDN is useful for pre-caching static resources, which helps in reducing the time-to-index and hence reduces the load time. Also, distributed data centers host CDNs. Therefore, the nearest CDN host will fetch the assets- boosting the performance of the website.
Hotlinking is the process of directly using the content from another site into the source website. Avoiding this will affect the bandwidth of both sites.
Also read – Everything you need to know about Test Automation as a Service.
Do you have any questions regarding your website performance? Feel free to comment or write to us at hello@mantralabsglobal.com & stay tuned for our next article on 8 Factors that Affect Page Load Time & Website Optimization Strategies.
Knowledge thats worth delivered in your inbox
Smart Manufacturing starts with real-time visibility.
Manufacturing companies today generate data by the second through sensors, machines, ERP systems, and MES platforms. But without real-time insights, even the most advanced production lines are essentially flying blind.
Manufacturers are implementing real-time dashboards that serve as control towers for their daily operations, enabling them to shift from reactive to proactive decision-making. These tools are essential to the evolution of Smart Manufacturing, where connected systems, automation, and intelligent analytics come together to drive measurable impact.
Data is available, but what’s missing is timely action.
For many plant leaders and COOs, one challenge persists: operational data is dispersed throughout systems, delayed, or hidden in spreadsheets. And this delay turns into a liability.
Real-time dashboards help uncover critical answers:
By converting raw inputs into real-time manufacturing analytics, dashboards make operational intelligence accessible to operators, supervisors, and leadership alike, enabling teams to anticipate problems rather than react to them.
Line performance and downtime trends
Track OEE in real time and identify underperforming lines.
Predictive maintenance alerts
Utilize historical and sensor data to identify potential part failures in advance.
Inventory heat maps & reorder thresholds
Anticipate stockouts or overstocks based on dynamic reorder points.
Quality metrics linked to operator actions
Isolate shifts or procedures correlated with spikes in defects or rework.
These insights allow production teams to drive day-to-day operations in line with Smart Manufacturing principles.
Role-based dashboards
Dashboards can be configured for machine operators, shift supervisors, and plant managers, each with a tailored view of KPIs.
Embedded alerts and nudges
Real-time prompts, like “Line 4 below efficiency threshold for 15+ minutes,” reduce response times and minimize disruptions.
Cross-functional drill-downs
Teams can identify root causes more quickly because users can move from plant-wide overviews to detailed machine-level data in seconds.
Data lakehouse integration
Unified access to ERP, MES, IoT sensor, and QA systems—ensuring reliable and timely manufacturing analytics.
ETL pipelines
Real-time data ingestion from high-frequency sources with minimal latency.
Visualization tools
Custom builds using Power BI, or customized solutions designed for frontline usability and operational impact.
Mantra Labs partnered with a North American die-casting manufacturer to unify its operational data into a real-time dashboard. Fragmented data, manual reporting, delayed pricing decisions, and inconsistent data quality hindered operational efficiency and strategic decision-making.
As this case shows, real-time dashboards are not just operational tools—they’re strategic enablers.
(Learn More: Powering the Future of Metal Manufacturing with Data Engineering)
| Aspect | What You Should Know |
| 1. Why Static Reports Fall Short | Delayed insights after issues occur Disconnected systems (ERP, MES, sensors) No real-time alerts or embedded decision logic |
| 2. What Real-Time Dashboards Enable | Track OEE and downtime in real-time Predictive maintenance using sensor data Dynamic inventory heat maps Quality linked to operators |
| 3. Dashboards That Drive Action | Role-based views (operator to CEO) Embedded alerts like “Line 4 down for 15+ mins” Drilldowns from plant-level to machine-level |
| 4. What Powers These Dashboards | Unified Data Lakehouse (ERP + IoT + MES) Real-time ETL pipelines Power BI or custom dashboards built for frontline usability |
Smart Manufacturing dashboards aren’t just analytics tools—they’re productivity engines. Dashboards that deliver real-time insight empower frontline teams to make faster, better decisions—whether it’s adjusting production schedules, triggering preventive maintenance, or responding to inventory fluctuations.
Explore how Mantra Labs can help you unlock operations intelligence that’s actually usable.
Knowledge thats worth delivered in your inbox


Our Sales Team will be in touch with you shortly.

Hello Stranger! Please fill in a few details,and you’ll receive a link to this case study.
 We have mailed you this case study.
Thanks for subscribing.
