


3 minutes read
Published on Jun 30, 2022
Updated on Jul 12, 2022
Create superior customer experiences to enhance competitive advantage.
Go from zero to breakthrough with scalable, future-proof solutions.
Harness deep tech for smarter solutions and maximum impact.
Accelerate value delivery with powerful pre-built digital tools.
Help businesses connect with an internet first generation.
Test the smarter way: where precision meets efficiency.
Unlock real-time and personalized customer journeys for mobile first generation.
Turn data into decisive action with scalable AI infrastructure.
Design agile digital foundations that scale with tomorrow's business needs.
Build new-age architecture for maximum efficiency and hyper-growth.
Fine-tune your cloud infrastructure for peak performance.
Automated compliance and control for global regulations.

All
Customer Experience
Mantra
Application Development
Insurtech
Digital Health
Insurance
Deep-Tech
AgriTech(1)
Augmented Reality(21)
Clean Tech(9)
Customer Journey(17)
Design(45)
Solar Industry(8)
User Experience(68)
Edtech(10)
Events(34)
HR Tech(3)
Interviews(10)
Life@mantra(11)
Logistics(6)
Manufacturing(5)
Strategy(18)
Testing(9)
Android(48)
Backend(32)
Dev Ops(11)
Enterprise Solution(33)
Technology Modernization(9)
Frontend(29)
iOS(43)
Javascript(15)
AI in Insurance(41)
Insurtech(67)
Product Innovation(59)
Solutions(22)
E-health(12)
HealthTech(25)
mHealth(5)
Telehealth Care(4)
Telemedicine(5)
Artificial Intelligence(154)
Bitcoin(8)
Blockchain(19)
Cognitive Computing(8)
Computer Vision(8)
Data Science(24)
FinTech(51)
Banking(7)
Intelligent Automation(27)
Machine Learning(48)
Natural Language Processing(14)
BlaBla car-a community-based travel network claims to have enabled over 90 million members to share a ride across 22 markets. Shared mobility which began in the 1940s in Switzerland has now become an essential part of our everyday lives. Numerous micro-mobility solutions, like Yulu, Bounce, and Rapido, are everywhere now.
According to Frost & Sullivan, the Indian shared mobility industry is expected to witness nearly four-fold growth. Revenues will touch $42.85 billion by 2027, growing at a CAGR of 25.3%.
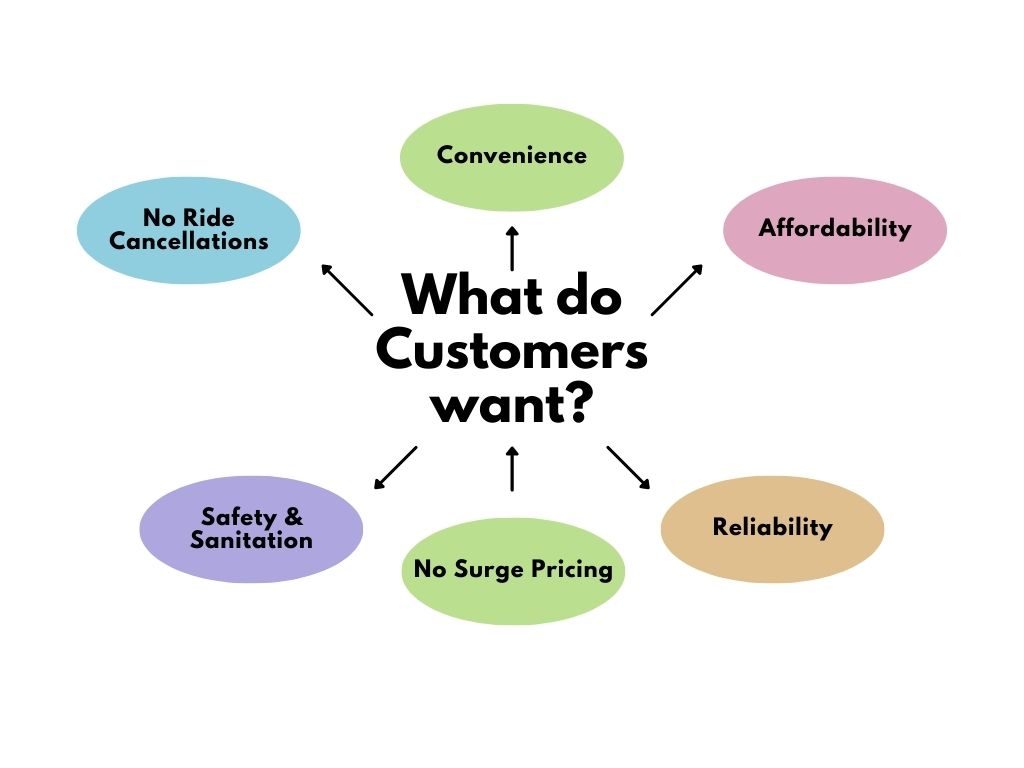
As we move into the experience economy, customer experience (CX) will play a vital role in retaining customers and acquiring the new segment-Gen Z. Zoomers or Gen Z are the most advanced, tech-savvy audience who rely on technology. They want a great digital experience to stay loyal to their favorite brands. They are quick to express on social media what they experience and feel about- be it good or bad. Right after the offices re-opened a few months ago, Uber and Ola users complained on social media about rides getting canceled. To minimize the possibility of cancellation, Uber started enabling drivers to view drop-off locations prior to accepting the rides.
Keeping in mind the evolving customer preferences and expectations, companies are constantly working on redefining customer experience in shared mobility. Chalo– a mobility startup offers live bus tracking and a live passenger indicator showing how crowded the bus is in real-time. Quick Ride offers people carpooling along with a Taxi/Cab app for local, airport, and outstation travels. This points out that enhancing customer experience has become a significant factor for shared mobility organizations to retain their customers. And it seems that the businesses operating in this ecosystem have a myriad of possibilities to grow. Here’s why:
EV ecosystem which is now in its nascent stage will evolve within the next few years. The government has been promoting EVs across the nation with the goal of achieving 50% vehicle electrification by 2030. Key players like Uber, Ola, and Vogo are planning to switch to electric vehicles. There’s already a long queue for Ola bikes amongst customers. The company recently announced to bring Ola electric car on the road by 2023.
Yulu is a mobility app to book & track trips, monitor bike health, report bike issues, check personal stats, and win rewards. Mantra Labs built a scalable platform for Yulu, enabling a scalable and easy-to-use app for users to access bike-sharing services. Consumers can check personal health stats (calories burnt), distance covered and amount of carbon emissions saved for each trip.
Redefining customer experience in shared mobility space is the need of the hour. We are heading towards an intelligent and connected world. Future automobiles will be more smarter than ever before. Recently, California regulators gave a nod to robotic taxi services to charge passengers for driverless rides in San Francisco. Tesla has been working on building autonomous vehicles for future customers. Given India’s massive population and infrastructural gap, it is difficult to say if autonomous vehicles would be feasible on Indian roads for now. But this may be possible in the future. As of now, the biggest challenge for companies is figuring out how to make the rider experience seamless, safe, convenient, and economical.
Knowledge thats worth delivered in your inbox
Smart Manufacturing starts with real-time visibility.
Manufacturing companies today generate data by the second through sensors, machines, ERP systems, and MES platforms. But without real-time insights, even the most advanced production lines are essentially flying blind.
Manufacturers are implementing real-time dashboards that serve as control towers for their daily operations, enabling them to shift from reactive to proactive decision-making. These tools are essential to the evolution of Smart Manufacturing, where connected systems, automation, and intelligent analytics come together to drive measurable impact.
Data is available, but what’s missing is timely action.
For many plant leaders and COOs, one challenge persists: operational data is dispersed throughout systems, delayed, or hidden in spreadsheets. And this delay turns into a liability.
Real-time dashboards help uncover critical answers:
By converting raw inputs into real-time manufacturing analytics, dashboards make operational intelligence accessible to operators, supervisors, and leadership alike, enabling teams to anticipate problems rather than react to them.
Line performance and downtime trends
Track OEE in real time and identify underperforming lines.
Predictive maintenance alerts
Utilize historical and sensor data to identify potential part failures in advance.
Inventory heat maps & reorder thresholds
Anticipate stockouts or overstocks based on dynamic reorder points.
Quality metrics linked to operator actions
Isolate shifts or procedures correlated with spikes in defects or rework.
These insights allow production teams to drive day-to-day operations in line with Smart Manufacturing principles.
Role-based dashboards
Dashboards can be configured for machine operators, shift supervisors, and plant managers, each with a tailored view of KPIs.
Embedded alerts and nudges
Real-time prompts, like “Line 4 below efficiency threshold for 15+ minutes,” reduce response times and minimize disruptions.
Cross-functional drill-downs
Teams can identify root causes more quickly because users can move from plant-wide overviews to detailed machine-level data in seconds.
Data lakehouse integration
Unified access to ERP, MES, IoT sensor, and QA systems—ensuring reliable and timely manufacturing analytics.
ETL pipelines
Real-time data ingestion from high-frequency sources with minimal latency.
Visualization tools
Custom builds using Power BI, or customized solutions designed for frontline usability and operational impact.
Mantra Labs partnered with a North American die-casting manufacturer to unify its operational data into a real-time dashboard. Fragmented data, manual reporting, delayed pricing decisions, and inconsistent data quality hindered operational efficiency and strategic decision-making.
As this case shows, real-time dashboards are not just operational tools—they’re strategic enablers.
(Learn More: Powering the Future of Metal Manufacturing with Data Engineering)
| Aspect | What You Should Know |
| 1. Why Static Reports Fall Short | Delayed insights after issues occur Disconnected systems (ERP, MES, sensors) No real-time alerts or embedded decision logic |
| 2. What Real-Time Dashboards Enable | Track OEE and downtime in real-time Predictive maintenance using sensor data Dynamic inventory heat maps Quality linked to operators |
| 3. Dashboards That Drive Action | Role-based views (operator to CEO) Embedded alerts like “Line 4 down for 15+ mins” Drilldowns from plant-level to machine-level |
| 4. What Powers These Dashboards | Unified Data Lakehouse (ERP + IoT + MES) Real-time ETL pipelines Power BI or custom dashboards built for frontline usability |
Smart Manufacturing dashboards aren’t just analytics tools—they’re productivity engines. Dashboards that deliver real-time insight empower frontline teams to make faster, better decisions—whether it’s adjusting production schedules, triggering preventive maintenance, or responding to inventory fluctuations.
Explore how Mantra Labs can help you unlock operations intelligence that’s actually usable.
Knowledge thats worth delivered in your inbox


Our Sales Team will be in touch with you shortly.

Hello Stranger! Please fill in a few details,and you’ll receive a link to this case study.
 We have mailed you this case study.
Thanks for subscribing.
