Try : Insurtech, Application Development

AgriTech(1)

Augmented Reality(21)

Clean Tech(9)

Customer Journey(17)

Design(45)

Solar Industry(8)

User Experience(68)

Edtech(10)

Events(34)

HR Tech(3)

Interviews(10)

Life@mantra(11)

Logistics(6)

Manufacturing(5)

Strategy(18)

Testing(9)

Android(48)

Backend(32)

Dev Ops(11)

Enterprise Solution(33)

Technology Modernization(9)

Frontend(29)

iOS(43)

Javascript(15)

AI in Insurance(41)

Insurtech(67)

Product Innovation(59)

Solutions(22)

E-health(12)

HealthTech(25)

mHealth(5)

Telehealth Care(4)

Telemedicine(5)

Artificial Intelligence(154)

Bitcoin(8)

Blockchain(19)

Cognitive Computing(8)

Computer Vision(8)

Data Science(24)

FinTech(51)

Banking(7)

Intelligent Automation(27)

Machine Learning(48)

Natural Language Processing(14)

expand Menu Filters

8 Factors that Affect Page Load Time & Website Optimization Strategies

4 minutes, 0 seconds read

A website’s page load time plays an important role in customer acquisition. Google states that if your website takes more than 3 seconds to load, over half of the visitors will leave it. Eventually, it leads to conversion and profits. Although there are online tools available to check your website loading time and performance (Lighthouse, for instance), it’s important to understand what affects your website’s page load time. You can then optimize your web page accordingly.

8 Factors that affect the page load time

#1 Web hosting

Today, no one would like to wait for a website to spin and load at its speed. Websites that load quickly perform more in user engagement, conversion rates, and user experience. Hence, it is very important to have a high-availability web hosting plans.

#2 Size of files

The page speed always depends on the size of the assets loaded on the browser. It is, therefore, good to have an optimum number of assets with the least possible file size. This will require lesser bandwidth.

#3 Number of HTTP requests

Greater the number of HTTP requests from a browser to server/server to server, the higher will be the bandwidth consumption. Therefore, keep the number of HTTP requests to the minimum possible.

#4 Absence of CDN

Using CDN will boost the performance of the web site. The absence of it will affect the load time. CDN is a content delivery/distribution network. It is a network of proxy servers and their data centres distributed across the globe to increase the performance and availability of services to the end-users.

#5 Mediocre coding

Bad coding will always affect the page performance and SEO ranking of the website. It is good to follow best practices starting from the initial stage of development.

#6 The number of redirections

The number of redirections impacts the DNS lookup time.

#7 Lack of Keep-Alive

If you’re using HTTP/1.0 protocol and have not configured Keep-Alive, then there’s a higher possibility that the browser to server connection will break. It will not load the page properly. 

#8 Hotlinking

Sourcing page content from other sites might affect the load time and performance of your website.

You might also like to read about 11 proven techniques to optimize website performance.

Strategies and checklist for website optimization

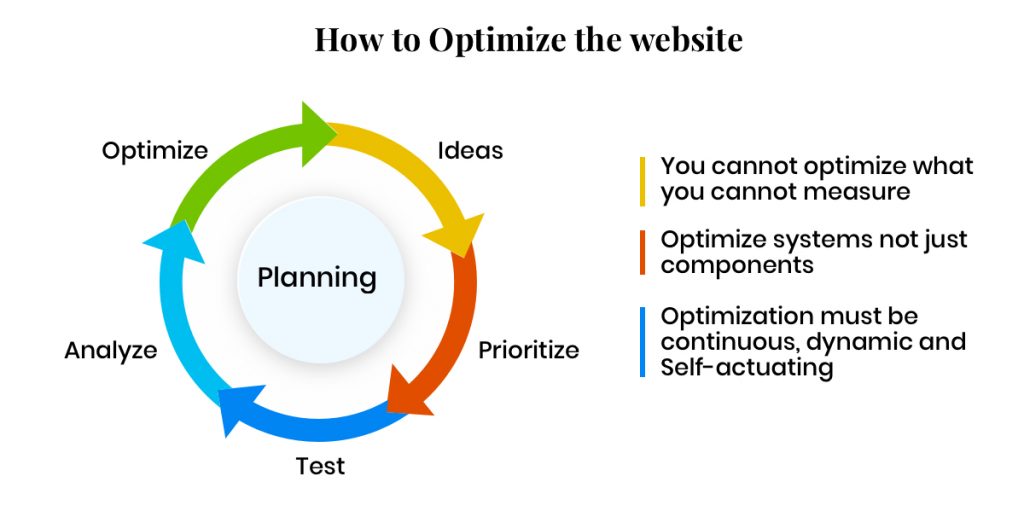
You can implement either bottom-up or top-down strategy for website optimization (discussed later). However, website optimization is an iterative process and you can repeat the following loop after completing a cycle.
How to optimize the website - Infographic
  1. Ideas: Prepare a checklist of all the possible strategies for the target website to optimize.
  2. Prioritize: Prioritize the prepared checklist strategies and act on them.
  3. Test: Test the applied strategies for enhanced performance.
  4. Analyze: Analyze the impact and performance of the website and check if any further strategies are required.
  5. Optimize: For further enhancement, perform the cycle again until you achieve the best.

#1 Bottom-up strategy

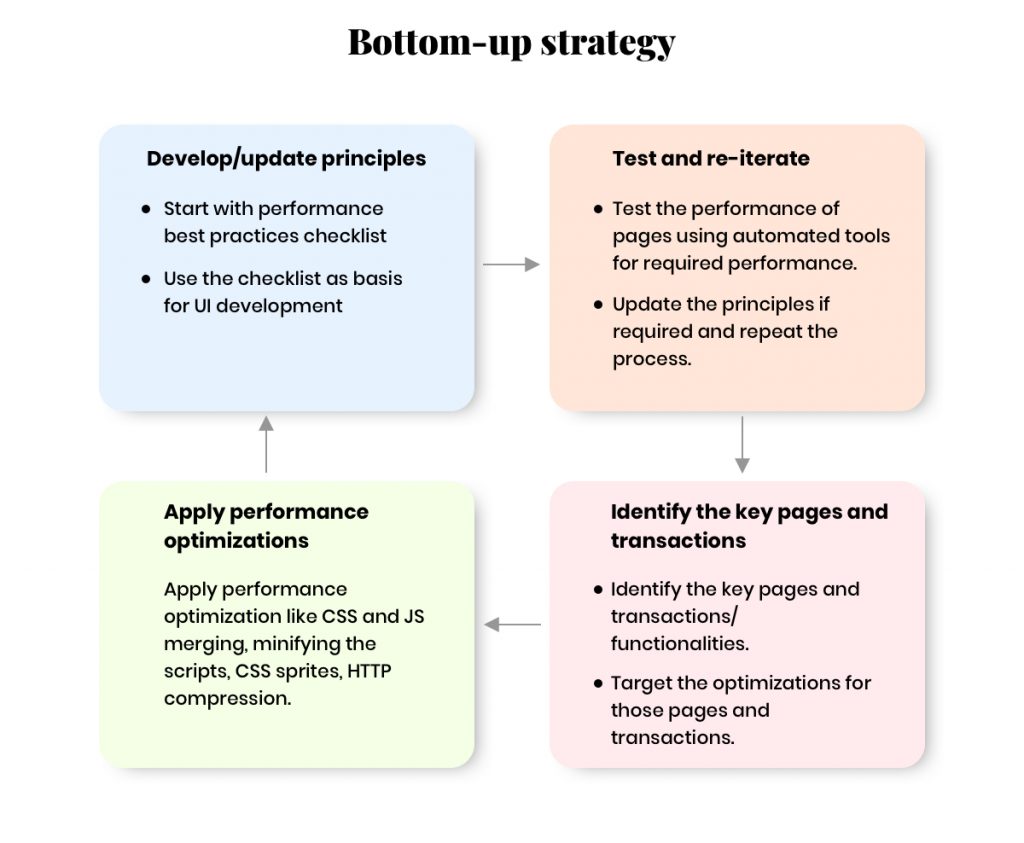
This strategy starts from planning to production (Proactive). It defines a set of rules and actions before/while starting the actual development.
Bottom up strategy for website optimization

The above infographic represents the lifecycle of Bottom-Up strategy in web page optimization.

#2 Top-down strategy 

It is a reactive method, which analyses the existing process to find the issue/lag, then reworks on behavioural grounds to accomplish the target. It is a reverse engineering process to identify the performance-issue gap and methods to fix them.

You can identify the resources which are affecting in maximum page load by considering the following-

  • Resource size
  • Asset positioning
  • Render blockers
  • Uncompressed contents
  • Bad requests

Once you’ve identified the sources, lay down the process of optimizing the content and keep iterating to achieve the desired results. 

Basic checklist for both bottom-up and top-down strategies 

  1. Layout performance principles
    1. Page load time
    2. Responsiveness
    3. Minimizing the number of requests
    4. Use Cache headers
    5. Minify CSS and JS contents
    6. Use CSS sprites
    7. Encourage Lazy loading on contents wherever possible
    8. Avoid iframes and redirects
  2. Executive performance principles
    1. During application design
    2. During application development

Consider the following aspects during the design and development phase.

#1 Application design optimizations

  1. Simple & lightweight: Include only key functionalities on load to keep it lightweight.
  2. Client side components: Adopt client side validation to catch errors.
  3. On demand data loading: Use on-demand data instead of pre-loaded data. (E.g. use paginations, pop-up contents on click instead of on load)
  4. Asynchronous calls: Adopt implementation of AJAX calls from the presentation tier and the business tier.

#2 Application development optimizations

  1. Include JS files at the bottom of the page (to avoid render blocking of page).
  2. Combine multiple CSS files and optimize unwanted rules as per page requirements.
  3. Avoid using external scripts at the beginning of the page.
  4. Combine smaller images/icons to sprite & have optimi.
  5. Use CSS rules/files in the head section of the document.
  6. Reduce the number of requests to server.
  7. Implement server/browser caching on possible sections.
  8. Implement Mobile-specific sections to avoid overloading on small screen devices.

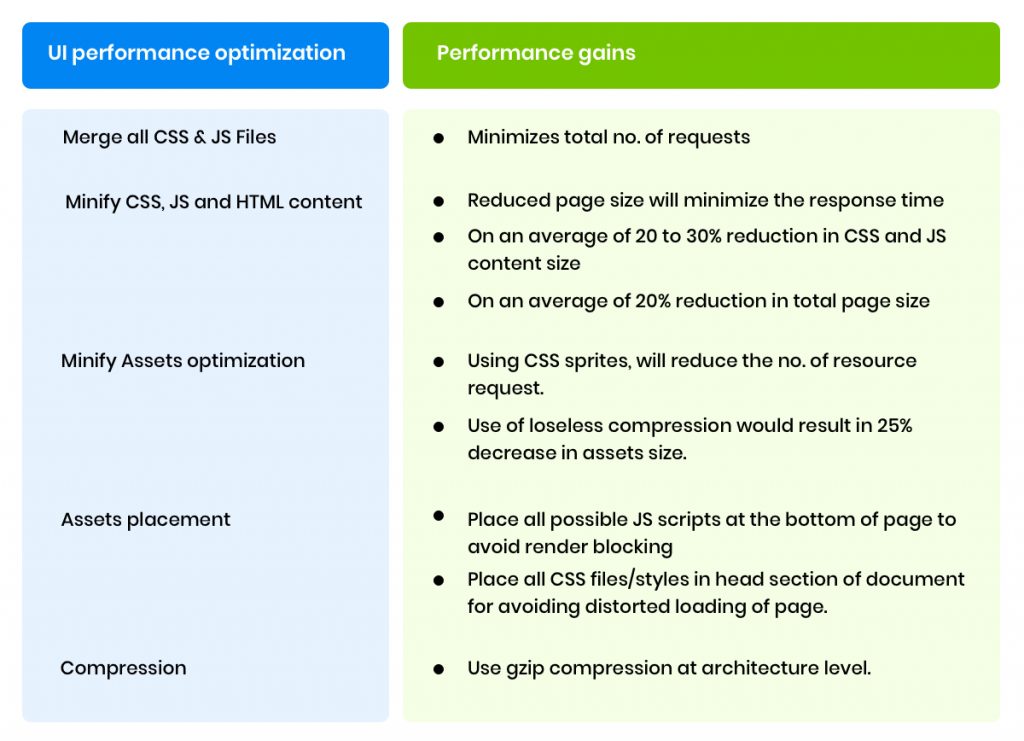
Below are few improvisation observations which are affected by optimizing the Webpage and it’s assets.
UI performance optimization and the performance gains - Infographic

We’re technology tinkerers, experimentalists, and experts in customer experience consulting. Get in touch with us at hello@mantralabsglobal.com to know more about our ventures in website design and experience consulting. 

Cancel

Knowledge thats worth delivered in your inbox

Smart Manufacturing Dashboards: A Real-Time Guide for Data-Driven Ops

Smart Manufacturing starts with real-time visibility.

Manufacturing companies today generate data by the second through sensors, machines, ERP systems, and MES platforms. But without real-time insights, even the most advanced production lines are essentially flying blind.

Manufacturers are implementing real-time dashboards that serve as control towers for their daily operations, enabling them to shift from reactive to proactive decision-making. These tools are essential to the evolution of Smart Manufacturing, where connected systems, automation, and intelligent analytics come together to drive measurable impact.

Data is available, but what’s missing is timely action.

For many plant leaders and COOs, one challenge persists: operational data is dispersed throughout systems, delayed, or hidden in spreadsheets. And this delay turns into a liability.

Real-time dashboards help uncover critical answers:

  • What caused downtime during last night’s shift?
  • Was there a delay in maintenance response?
  • Did a specific inventory threshold trigger a quality issue?

By converting raw inputs into real-time manufacturing analytics, dashboards make operational intelligence accessible to operators, supervisors, and leadership alike, enabling teams to anticipate problems rather than react to them.

1. Why Static Reports Fall Short

  • Reports often arrive late—after downtime, delays, or defects have occurred.
  • Disconnected data across ERP, MES, and sensors limits cross-functional insights.
  • Static formats lack embedded logic for proactive decision support.

2. What Real-Time Dashboards Enable

Line performance and downtime trends
Track OEE in real time and identify underperforming lines.

Predictive maintenance alerts
Utilize historical and sensor data to identify potential part failures in advance.

Inventory heat maps & reorder thresholds
Anticipate stockouts or overstocks based on dynamic reorder points.

Quality metrics linked to operator actions
Isolate shifts or procedures correlated with spikes in defects or rework.

These insights allow production teams to drive day-to-day operations in line with Smart Manufacturing principles.

3. Dashboards That Drive Action

Role-based dashboards
Dashboards can be configured for machine operators, shift supervisors, and plant managers, each with a tailored view of KPIs.

Embedded alerts and nudges
Real-time prompts, like “Line 4 below efficiency threshold for 15+ minutes,” reduce response times and minimize disruptions.

Cross-functional drill-downs
Teams can identify root causes more quickly because users can move from plant-wide overviews to detailed machine-level data in seconds.

4. What Powers These Dashboards

Data lakehouse integration
Unified access to ERP, MES, IoT sensor, and QA systems—ensuring reliable and timely manufacturing analytics.

ETL pipelines
Real-time data ingestion from high-frequency sources with minimal latency.

Visualization tools
Custom builds using Power BI, or customized solutions designed for frontline usability and operational impact.

Smart Manufacturing in Action: Reducing Market Response Time from 48 Hours to 30 Minutes

Mantra Labs partnered with a North American die-casting manufacturer to unify its operational data into a real-time dashboard. Fragmented data, manual reporting, delayed pricing decisions, and inconsistent data quality hindered operational efficiency and strategic decision-making.

Tech Enablement:

  • Centralized Data Hub with real-time access to critical business insights.
  • Automated report generation with data ingestion and processing.
  • Accurate price modeling with real-time visibility into metal price trends, cost impacts, and customer-specific pricing scenarios. 
  • Proactive market analysis with intuitive Power BI dashboards and reports.

Business Outcomes:

  • Faster response to machine alerts
  • Quality incidents traced to specific operator workflows
  • 4X faster access to insights led to improved inventory optimization.

As this case shows, real-time dashboards are not just operational tools—they’re strategic enablers. 

(Learn More: Powering the Future of Metal Manufacturing with Data Engineering)

Key Takeaways: Smart Manufacturing Dashboards at a Glance

AspectWhat You Should Know
1. Why Static Reports Fall ShortDelayed insights after issues occur
Disconnected systems (ERP, MES, sensors)
No real-time alerts or embedded decision logic
2. What Real-Time Dashboards EnableTrack OEE and downtime in real-time
Predictive maintenance using sensor data
Dynamic inventory heat maps
Quality linked to operators
3. Dashboards That Drive ActionRole-based views (operator to CEO)
Embedded alerts like “Line 4 down for 15+ mins”
Drilldowns from plant-level to machine-level
4. What Powers These DashboardsUnified Data Lakehouse (ERP + IoT + MES)
Real-time ETL pipelines
Power BI or custom dashboards built for frontline usability

Conclusion

Smart Manufacturing dashboards aren’t just analytics tools—they’re productivity engines. Dashboards that deliver real-time insight empower frontline teams to make faster, better decisions—whether it’s adjusting production schedules, triggering preventive maintenance, or responding to inventory fluctuations.

Explore how Mantra Labs can help you unlock operations intelligence that’s actually usable.

Cancel

Knowledge thats worth delivered in your inbox

Loading More Posts ...
Go Top
ml floating chatbot