


3 minutes, 13 seconds read
Published on Oct 23, 2020
Updated on Oct 28, 2020
Create superior customer experiences to enhance competitive advantage.
Go from zero to breakthrough with scalable, future-proof solutions.
Harness deep tech for smarter solutions and maximum impact.
Accelerate value delivery with powerful pre-built digital tools.
Help businesses connect with an internet first generation.
Test the smarter way: where precision meets efficiency.
Unlock real-time and personalized customer journeys for mobile first generation.
Turn data into decisive action with scalable AI infrastructure.
Design agile digital foundations that scale with tomorrow's business needs.
Build new-age architecture for maximum efficiency and hyper-growth.
Fine-tune your cloud infrastructure for peak performance.
Automated compliance and control for global regulations.

All
Customer Experience
Mantra
Application Development
Insurtech
Digital Health
Insurance
Deep-Tech
AgriTech(1)
Augmented Reality(21)
Clean Tech(9)
Customer Journey(17)
Design(45)
Solar Industry(8)
User Experience(68)
Edtech(10)
Events(34)
HR Tech(3)
Interviews(10)
Life@mantra(11)
Logistics(6)
Manufacturing(5)
Strategy(18)
Testing(9)
Android(48)
Backend(32)
Dev Ops(11)
Enterprise Solution(33)
Technology Modernization(9)
Frontend(29)
iOS(43)
Javascript(15)
AI in Insurance(41)
Insurtech(67)
Product Innovation(59)
Solutions(22)
E-health(12)
HealthTech(25)
mHealth(5)
Telehealth Care(4)
Telemedicine(5)
Artificial Intelligence(154)
Bitcoin(8)
Blockchain(19)
Cognitive Computing(8)
Computer Vision(8)
Data Science(24)
FinTech(51)
Banking(7)
Intelligent Automation(27)
Machine Learning(48)
Natural Language Processing(14)
What do you call a prediction model that performs tremendously well on the same data it was trained on? Technically, a tosh! It will perform feebly on unseen data, thus leading to a state called overfitting.
To combat such a scenario, the dataset is split into train set and test set. The model is then trained on the train set and is kept deprived of the test set. This test set is utilized to estimate the efficacy of the model. To decide on the best train-test split, two competing cornerstones need to be focused on. Firstly, less training data will give rise to greater variance in the parameter estimates, and secondly, less testing data will lead to greater variance in the performance statistic. Conventionally, an 80/20 split is considered to be a suitable starting point such that neither variance is too high.
Yet another problem arises when we try to fine-tune the hyperparameters. There is a possibility for the model to still overfit on the testing data due to data leakage. To prevent this, a dataset should typically be divided into train, validation, and test sets. The validation set acts as an intermediary between the training part and the final evaluation part. However, this indeed reduces the training examples, thus making it less likely for the model to generalize, and the performance rather depends merely on a random split.
Here’s where cross-validation comes to our rescue!
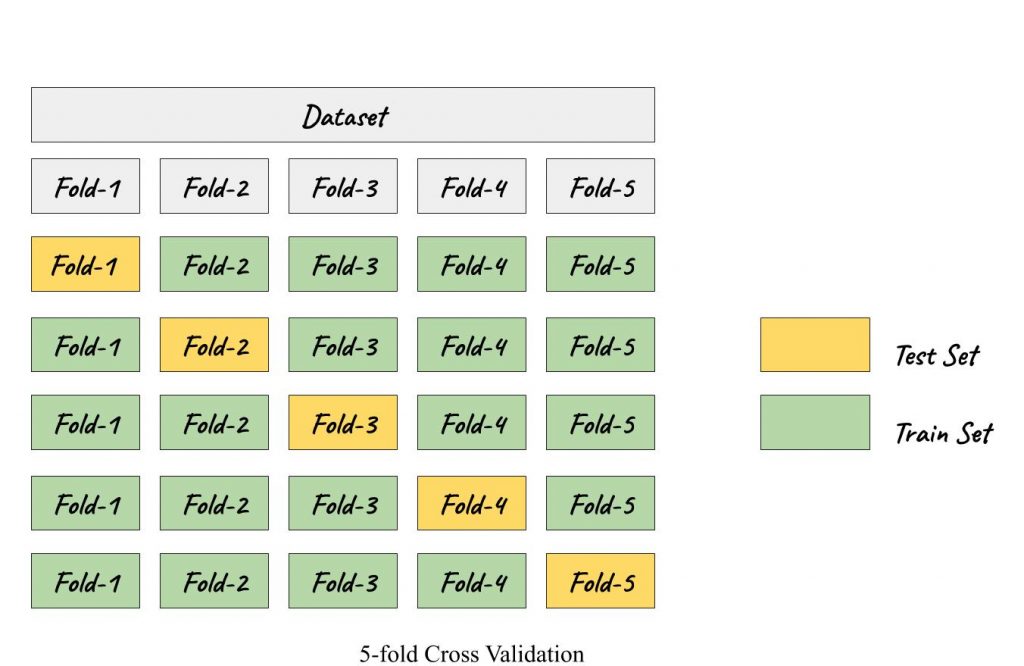
Cross-validation (CV) eliminates the explicit requirement of a validation set. It facilitates the model selection and aids in gauging the generalizing capability of a model. The rudimentary modus operandi is the k-fold CV, where the dataset is split into k groups/folds and k-1 folds are used to train the model, while the held out kth fold is used to validate the model. Henceforth, each fold gets an opportunity to be used as a test set. This way, in each fold, the evaluation score is retained and the model is then discarded. The model’s skill is summarised by the mean of the evaluation scores. The variance of the evaluated scores is often expressed in terms of standard deviation.
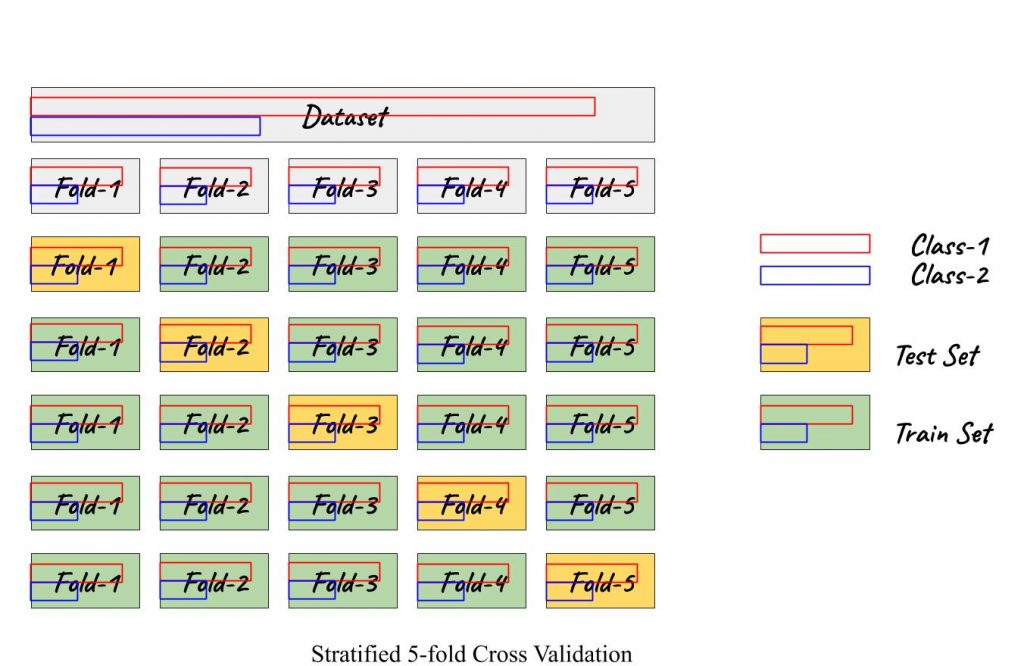
But is it feasible when the dataset is imbalanced?
Probably not! In case of imbalanced data an extension to k-fold CV, called Stratified k-fold CV proves to be the magic bullet. It maintains the class proportion in all the folds as it was in the original dataset, thus making it available for the model to train on both, the minority as well as majority classes.
Determining the value of k
This is a baffling concern though! Taking into account the bias-variance trade-off, the value of k should be decided carefully. Consequently, the k value should be chosen such that each fold can act as a representative of the dataset. Jumping on the bandwagon, it is preferred to set the k value as 5 or 10 since experimental success is observed with these values.
There are some other variations of cross-validation viz.,
Finally yet importantly, some tidbits that shouldn’t be ignored:
Voila! We finally made it! If the model evaluation scores are acceptably high and have low variance, it’s time to party hard! Our mojo has worked!
Knowledge thats worth delivered in your inbox
Smart Manufacturing starts with real-time visibility.
Manufacturing companies today generate data by the second through sensors, machines, ERP systems, and MES platforms. But without real-time insights, even the most advanced production lines are essentially flying blind.
Manufacturers are implementing real-time dashboards that serve as control towers for their daily operations, enabling them to shift from reactive to proactive decision-making. These tools are essential to the evolution of Smart Manufacturing, where connected systems, automation, and intelligent analytics come together to drive measurable impact.
Data is available, but what’s missing is timely action.
For many plant leaders and COOs, one challenge persists: operational data is dispersed throughout systems, delayed, or hidden in spreadsheets. And this delay turns into a liability.
Real-time dashboards help uncover critical answers:
By converting raw inputs into real-time manufacturing analytics, dashboards make operational intelligence accessible to operators, supervisors, and leadership alike, enabling teams to anticipate problems rather than react to them.
Line performance and downtime trends
Track OEE in real time and identify underperforming lines.
Predictive maintenance alerts
Utilize historical and sensor data to identify potential part failures in advance.
Inventory heat maps & reorder thresholds
Anticipate stockouts or overstocks based on dynamic reorder points.
Quality metrics linked to operator actions
Isolate shifts or procedures correlated with spikes in defects or rework.
These insights allow production teams to drive day-to-day operations in line with Smart Manufacturing principles.
Role-based dashboards
Dashboards can be configured for machine operators, shift supervisors, and plant managers, each with a tailored view of KPIs.
Embedded alerts and nudges
Real-time prompts, like “Line 4 below efficiency threshold for 15+ minutes,” reduce response times and minimize disruptions.
Cross-functional drill-downs
Teams can identify root causes more quickly because users can move from plant-wide overviews to detailed machine-level data in seconds.
Data lakehouse integration
Unified access to ERP, MES, IoT sensor, and QA systems—ensuring reliable and timely manufacturing analytics.
ETL pipelines
Real-time data ingestion from high-frequency sources with minimal latency.
Visualization tools
Custom builds using Power BI, or customized solutions designed for frontline usability and operational impact.
Mantra Labs partnered with a North American die-casting manufacturer to unify its operational data into a real-time dashboard. Fragmented data, manual reporting, delayed pricing decisions, and inconsistent data quality hindered operational efficiency and strategic decision-making.
As this case shows, real-time dashboards are not just operational tools—they’re strategic enablers.
(Learn More: Powering the Future of Metal Manufacturing with Data Engineering)
| Aspect | What You Should Know |
| 1. Why Static Reports Fall Short | Delayed insights after issues occur Disconnected systems (ERP, MES, sensors) No real-time alerts or embedded decision logic |
| 2. What Real-Time Dashboards Enable | Track OEE and downtime in real-time Predictive maintenance using sensor data Dynamic inventory heat maps Quality linked to operators |
| 3. Dashboards That Drive Action | Role-based views (operator to CEO) Embedded alerts like “Line 4 down for 15+ mins” Drilldowns from plant-level to machine-level |
| 4. What Powers These Dashboards | Unified Data Lakehouse (ERP + IoT + MES) Real-time ETL pipelines Power BI or custom dashboards built for frontline usability |
Smart Manufacturing dashboards aren’t just analytics tools—they’re productivity engines. Dashboards that deliver real-time insight empower frontline teams to make faster, better decisions—whether it’s adjusting production schedules, triggering preventive maintenance, or responding to inventory fluctuations.
Explore how Mantra Labs can help you unlock operations intelligence that’s actually usable.
Knowledge thats worth delivered in your inbox


Our Sales Team will be in touch with you shortly.

Hello Stranger! Please fill in a few details,and you’ll receive a link to this case study.
 We have mailed you this case study.
Thanks for subscribing.
