Try : Insurtech, Application Development

AgriTech(1)

Augmented Reality(21)

Clean Tech(9)

Customer Journey(17)

Design(45)

Solar Industry(8)

User Experience(68)

Edtech(10)

Events(34)

HR Tech(3)

Interviews(10)

Life@mantra(11)

Logistics(6)

Manufacturing(5)

Strategy(18)

Testing(9)

Android(48)

Backend(32)

Dev Ops(11)

Enterprise Solution(33)

Technology Modernization(9)

Frontend(29)

iOS(43)

Javascript(15)

AI in Insurance(41)

Insurtech(67)

Product Innovation(59)

Solutions(22)

E-health(12)

HealthTech(25)

mHealth(5)

Telehealth Care(4)

Telemedicine(5)

Artificial Intelligence(154)

Bitcoin(8)

Blockchain(19)

Cognitive Computing(8)

Computer Vision(8)

Data Science(24)

FinTech(51)

Banking(7)

Intelligent Automation(27)

Machine Learning(48)

Natural Language Processing(14)

expand Menu Filters

A Sandbox Approach in Insurance

The insurance industry has reached an evolutionary crossroad. The fast-evolving world of InsurTech mandates that insurers become digitally agile. With Fintech solutions becoming more common, a responsive approach would enhance the ability of promising insurance innovations to develop and flourish.

There are various technologies stepping into the value chain to enhance and disrupt the way insurance businesses used to function earlier. The industry should consider testing their products in a controlled environment or a ‘Sandbox’. This approach can provide certain advantages such as allowing insurers to launch unconventional products on a pilot-basis before seeking necessary approval.

A sandbox approach in insurance can be used to carve out a safe and conducive space to experiment with innovative Insurtech solutions. It is a process of experimenting on a limited scale initially, where the consequences of failure can be contained before finally being adopted; consequently not allowing regulation in being a constricting force in their innovation journey.

Sandbox approach, a global affair:

Implementation of the sandbox to test customer’s interest is now a global call. It is being implemented in most region’s financial hubs including UAE, Australia, Canada, Hong Kong, Malaysia, Singapore, Switzerland, and the UK.

The FCA (Financial Conduct Authority) the UK, the British financial regulator was the first to launch the Fintech sandbox, back in 2016. The FCA reported 90% of firms that completed testing in the sandbox are continuing towards wider market launch.

Under the FCA Cohort System used in their Sandboxes, the focus of current testing includes; Blockchain-based payment services, Reg tech propositions, general insurance, AML controls, Biometric Digital ID and know your customer (KYC) verification.

One of the most surprising aspects is the growing number of countries that have proposed the sandbox approach to remain competitive with those already on board. These include countries such as Indonesia, Israel, Russia, Taiwan and the USA.

First launch in India:

“In the recent past, new Insurance companies and Insurance intermediaries have carried out technological innovations in their products and services,”

“The authority encourages companies to develop such new technologies to add value for customers, increase efficiency, and better manage risks.”

 S C Khunita, IRDAI chairperson, was quoted as saying by the Times of India.

NITI Aayog had organised a day-long Fintech Conclave on 25th March 2019, with the objective to shape India’s continued ascendancy in Fintech. It featured representatives from across the financial ecosystem. Mr Shaktikanta Das, RBI Governor; confirmed that the RBI will come out with the necessary regulations for the sandbox in the Fintech sector within two months to ensure regulatory compliance.

IndiaFirst Life insurance company was the first to launch an insurance plan under the sandbox approach; on 12th April 2017 and got approval for the launch on 27th November 2017. The plan was called “Insurance Khata”. It was directed towards those with seasonal incomes, mostly belonging to the underserved sections of Indian society. It lets buyers pool multiple single insurance plans into an account and allow payment of premiums as per the user’s convenience.

” Use a Sandbox approach to test customer’s interest ” was one of the key takeaways of The Indian Insurance Summit & Awards 2019.
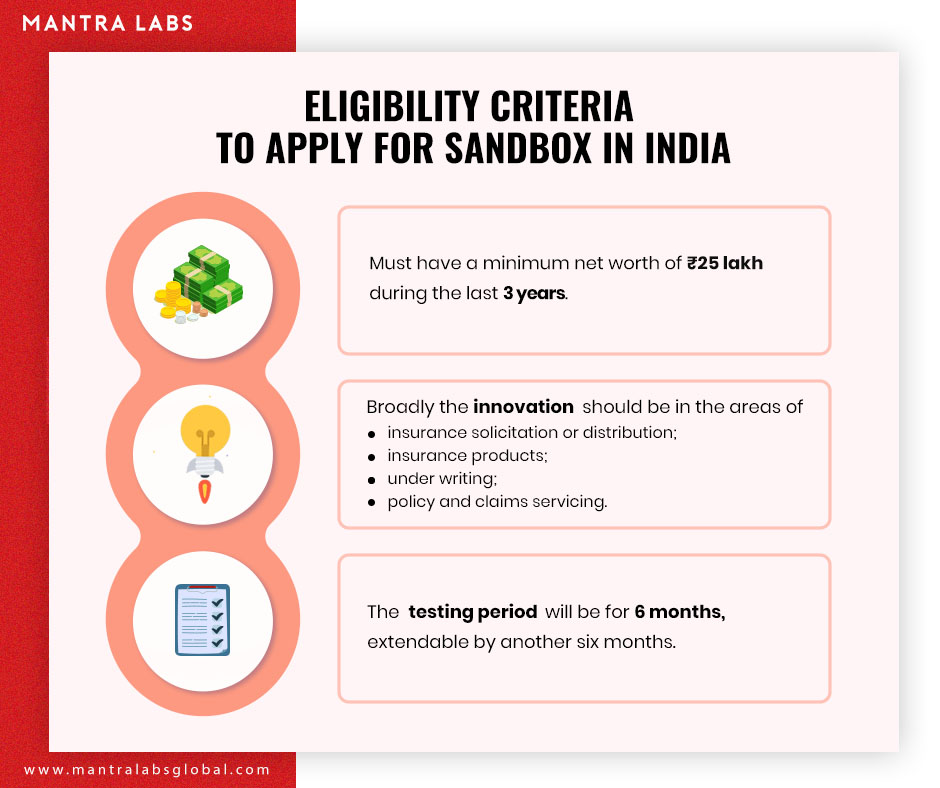
sandbox approach in insurance infographic

Eligibility Criteria for Insurers or Insurance intermediaries to apply for Sandbox in India:

A 10-member committee comprising IRDAI officials and representatives of Insurance companies and the World Bank has been set up to regulate the sandbox process. The panel has been asked to dwell on the key regulatory issues Fintech poses across the insurance value chain.

Despite recent advances, insurance remains a tough industry for innovation. However, the fast-growing interest in “Insurtech” is reflected in its popularity as a google search term since 2016.

Insurance penetration in India is only 3.69% of GDP against a global average of 6.2%; the Sandbox Approach for testing the new products can help improve these numbers. The “Sandbox Approach” offers a plethora of opportunities for the Insurance Industry to set out on a journey and expand their reach into more ecosystems than ever before.

Cancel

Knowledge thats worth delivered in your inbox

Smart Manufacturing Dashboards: A Real-Time Guide for Data-Driven Ops

Smart Manufacturing starts with real-time visibility.

Manufacturing companies today generate data by the second through sensors, machines, ERP systems, and MES platforms. But without real-time insights, even the most advanced production lines are essentially flying blind.

Manufacturers are implementing real-time dashboards that serve as control towers for their daily operations, enabling them to shift from reactive to proactive decision-making. These tools are essential to the evolution of Smart Manufacturing, where connected systems, automation, and intelligent analytics come together to drive measurable impact.

Data is available, but what’s missing is timely action.

For many plant leaders and COOs, one challenge persists: operational data is dispersed throughout systems, delayed, or hidden in spreadsheets. And this delay turns into a liability.

Real-time dashboards help uncover critical answers:

  • What caused downtime during last night’s shift?
  • Was there a delay in maintenance response?
  • Did a specific inventory threshold trigger a quality issue?

By converting raw inputs into real-time manufacturing analytics, dashboards make operational intelligence accessible to operators, supervisors, and leadership alike, enabling teams to anticipate problems rather than react to them.

1. Why Static Reports Fall Short

  • Reports often arrive late—after downtime, delays, or defects have occurred.
  • Disconnected data across ERP, MES, and sensors limits cross-functional insights.
  • Static formats lack embedded logic for proactive decision support.

2. What Real-Time Dashboards Enable

Line performance and downtime trends
Track OEE in real time and identify underperforming lines.

Predictive maintenance alerts
Utilize historical and sensor data to identify potential part failures in advance.

Inventory heat maps & reorder thresholds
Anticipate stockouts or overstocks based on dynamic reorder points.

Quality metrics linked to operator actions
Isolate shifts or procedures correlated with spikes in defects or rework.

These insights allow production teams to drive day-to-day operations in line with Smart Manufacturing principles.

3. Dashboards That Drive Action

Role-based dashboards
Dashboards can be configured for machine operators, shift supervisors, and plant managers, each with a tailored view of KPIs.

Embedded alerts and nudges
Real-time prompts, like “Line 4 below efficiency threshold for 15+ minutes,” reduce response times and minimize disruptions.

Cross-functional drill-downs
Teams can identify root causes more quickly because users can move from plant-wide overviews to detailed machine-level data in seconds.

4. What Powers These Dashboards

Data lakehouse integration
Unified access to ERP, MES, IoT sensor, and QA systems—ensuring reliable and timely manufacturing analytics.

ETL pipelines
Real-time data ingestion from high-frequency sources with minimal latency.

Visualization tools
Custom builds using Power BI, or customized solutions designed for frontline usability and operational impact.

Smart Manufacturing in Action: Reducing Market Response Time from 48 Hours to 30 Minutes

Mantra Labs partnered with a North American die-casting manufacturer to unify its operational data into a real-time dashboard. Fragmented data, manual reporting, delayed pricing decisions, and inconsistent data quality hindered operational efficiency and strategic decision-making.

Tech Enablement:

  • Centralized Data Hub with real-time access to critical business insights.
  • Automated report generation with data ingestion and processing.
  • Accurate price modeling with real-time visibility into metal price trends, cost impacts, and customer-specific pricing scenarios. 
  • Proactive market analysis with intuitive Power BI dashboards and reports.

Business Outcomes:

  • Faster response to machine alerts
  • Quality incidents traced to specific operator workflows
  • 4X faster access to insights led to improved inventory optimization.

As this case shows, real-time dashboards are not just operational tools—they’re strategic enablers. 

(Learn More: Powering the Future of Metal Manufacturing with Data Engineering)

Key Takeaways: Smart Manufacturing Dashboards at a Glance

AspectWhat You Should Know
1. Why Static Reports Fall ShortDelayed insights after issues occur
Disconnected systems (ERP, MES, sensors)
No real-time alerts or embedded decision logic
2. What Real-Time Dashboards EnableTrack OEE and downtime in real-time
Predictive maintenance using sensor data
Dynamic inventory heat maps
Quality linked to operators
3. Dashboards That Drive ActionRole-based views (operator to CEO)
Embedded alerts like “Line 4 down for 15+ mins”
Drilldowns from plant-level to machine-level
4. What Powers These DashboardsUnified Data Lakehouse (ERP + IoT + MES)
Real-time ETL pipelines
Power BI or custom dashboards built for frontline usability

Conclusion

Smart Manufacturing dashboards aren’t just analytics tools—they’re productivity engines. Dashboards that deliver real-time insight empower frontline teams to make faster, better decisions—whether it’s adjusting production schedules, triggering preventive maintenance, or responding to inventory fluctuations.

Explore how Mantra Labs can help you unlock operations intelligence that’s actually usable.

Cancel

Knowledge thats worth delivered in your inbox

Loading More Posts ...
Go Top
ml floating chatbot