


2 minutes, 46 seconds read
Published on Aug 6, 2020
Updated on Aug 14, 2020
Create superior customer experiences to enhance competitive advantage.
Go from zero to breakthrough with scalable, future-proof solutions.
Harness deep tech for smarter solutions and maximum impact.
Accelerate value delivery with powerful pre-built digital tools.
Help businesses connect with an internet first generation.
Test the smarter way: where precision meets efficiency.
Unlock real-time and personalized customer journeys for mobile first generation.
Turn data into decisive action with scalable AI infrastructure.
Design agile digital foundations that scale with tomorrow's business needs.
Build new-age architecture for maximum efficiency and hyper-growth.
Fine-tune your cloud infrastructure for peak performance.
Automated compliance and control for global regulations.

All
Customer Experience
Mantra
Application Development
Insurtech
Digital Health
Insurance
Deep-Tech
AgriTech(1)
Augmented Reality(21)
Clean Tech(9)
Customer Journey(17)
Design(45)
Solar Industry(8)
User Experience(68)
Edtech(10)
Events(34)
HR Tech(3)
Interviews(10)
Life@mantra(11)
Logistics(6)
Manufacturing(5)
Strategy(18)
Testing(9)
Android(48)
Backend(32)
Dev Ops(11)
Enterprise Solution(33)
Technology Modernization(9)
Frontend(29)
iOS(43)
Javascript(15)
AI in Insurance(41)
Insurtech(67)
Product Innovation(59)
Solutions(22)
E-health(12)
HealthTech(25)
mHealth(5)
Telehealth Care(4)
Telemedicine(5)
Artificial Intelligence(154)
Bitcoin(8)
Blockchain(19)
Cognitive Computing(8)
Computer Vision(8)
Data Science(24)
FinTech(51)
Banking(7)
Intelligent Automation(27)
Machine Learning(48)
Natural Language Processing(14)
JSON stands for JavaScript Object Notation. It is a subset of JavaScript and an efficient way to deal with data over the internet. It is mainly used for exchanging and storing data. JSON organizes the data quite smoothly and enables easy access. Moreover, it collects data in “forms”, which is readable for humans.
In the early 2000s, JSON format was defined by Douglas Crockford. There are certain rules for JSON syntax which we need to follow for efficient performance. These include the use of square brackets, curly brackets, commas, and value pairs or names. When it comes to the data, then it is necessary to be in the form of value pairs or name. Along the same lines, commas separate data; square and curly brackets hold arrays and objects. Let’s dig into JSON a bit deeper.
JSON is easy for servers as well. Since it deals with the pain text, it makes it easier for servers to interpret data quickly. JSON follows all JavaScript rules and its syntax works impressively on the JavaScript standards. Many people misunderstand JSON as an object. However, it is not true.
Although JSON utilizes JavaScript format, it is a completely different programming language. JSON is responsible for converting data into JS forms of objects in order to store them as text. Besides storing data, you can also use the JSON format for accessing the data.
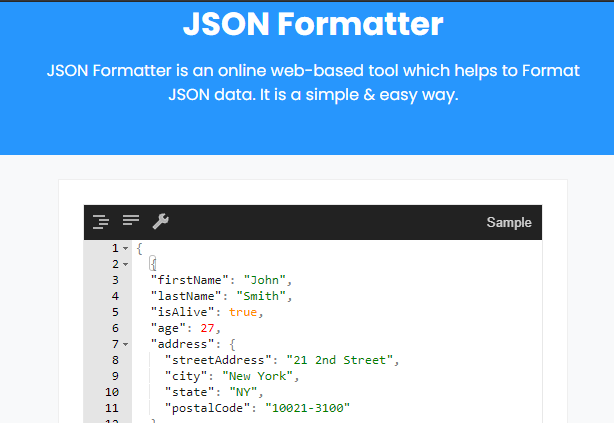
The JSON Formatter is designed to provide the best possible debugging. It is independent and lightweight, which perfectly kicks out the issue of readability. The output from this tool is without link breaks, which saves a lot of device space. JSON Formatter is an amazing online tool that supports all browsers. All you need to do is – submit JSON format file and press enter for output!
There are a number of free online tools to prettify JSON files. To prettify means – making a more readable version of the data. Many people don’t have a firm grip on coding and computer terminologies. If such is the case, you can use online tools for coding and debugging. You can also prettify JSON using the following keys:
OS X: CMD+Ctrl+J
Windows: Ctrl+Alt+J
Linux: Ctrl+Alt+J
Such tools also help in converting files into the desired format. In addition to this, JSON format online provides you lots more facilities to accomplish complex tasks in minimum possible time.
Every software has its own extension for storing data and that’s simply JSON. With this extension, you can store or access the written programming code. Application/JSON is used for the Internet Media files, and for the Uniform Type Identifier, public.json is used.
In JSON, users cannot use functions but must mention them as a string. It is possible to convert such strings into functions later on.
JSON Formatter is an independent tool that provides a new structure to your coding through easy parsing. However, users need to follow all the XML procedures accurately (usually it’s a three-level process) to get full benefits of JSON coding.
You can also use online resources like JsonOnline.net to view, edit, format, and transform different JSON documents.
About the author: Urooj Ashraf is the reputation Manager at TurboRankers and has previously worked as Article writer on freelancing platforms. She’s an expert in inbound marketing, WordPress Development and lead generation. Urooj is also an author at daayri.com. Contact her.
Related reads:
Knowledge thats worth delivered in your inbox
Smart Manufacturing starts with real-time visibility.
Manufacturing companies today generate data by the second through sensors, machines, ERP systems, and MES platforms. But without real-time insights, even the most advanced production lines are essentially flying blind.
Manufacturers are implementing real-time dashboards that serve as control towers for their daily operations, enabling them to shift from reactive to proactive decision-making. These tools are essential to the evolution of Smart Manufacturing, where connected systems, automation, and intelligent analytics come together to drive measurable impact.
Data is available, but what’s missing is timely action.
For many plant leaders and COOs, one challenge persists: operational data is dispersed throughout systems, delayed, or hidden in spreadsheets. And this delay turns into a liability.
Real-time dashboards help uncover critical answers:
By converting raw inputs into real-time manufacturing analytics, dashboards make operational intelligence accessible to operators, supervisors, and leadership alike, enabling teams to anticipate problems rather than react to them.
Line performance and downtime trends
Track OEE in real time and identify underperforming lines.
Predictive maintenance alerts
Utilize historical and sensor data to identify potential part failures in advance.
Inventory heat maps & reorder thresholds
Anticipate stockouts or overstocks based on dynamic reorder points.
Quality metrics linked to operator actions
Isolate shifts or procedures correlated with spikes in defects or rework.
These insights allow production teams to drive day-to-day operations in line with Smart Manufacturing principles.
Role-based dashboards
Dashboards can be configured for machine operators, shift supervisors, and plant managers, each with a tailored view of KPIs.
Embedded alerts and nudges
Real-time prompts, like “Line 4 below efficiency threshold for 15+ minutes,” reduce response times and minimize disruptions.
Cross-functional drill-downs
Teams can identify root causes more quickly because users can move from plant-wide overviews to detailed machine-level data in seconds.
Data lakehouse integration
Unified access to ERP, MES, IoT sensor, and QA systems—ensuring reliable and timely manufacturing analytics.
ETL pipelines
Real-time data ingestion from high-frequency sources with minimal latency.
Visualization tools
Custom builds using Power BI, or customized solutions designed for frontline usability and operational impact.
Mantra Labs partnered with a North American die-casting manufacturer to unify its operational data into a real-time dashboard. Fragmented data, manual reporting, delayed pricing decisions, and inconsistent data quality hindered operational efficiency and strategic decision-making.
As this case shows, real-time dashboards are not just operational tools—they’re strategic enablers.
(Learn More: Powering the Future of Metal Manufacturing with Data Engineering)
| Aspect | What You Should Know |
| 1. Why Static Reports Fall Short | Delayed insights after issues occur Disconnected systems (ERP, MES, sensors) No real-time alerts or embedded decision logic |
| 2. What Real-Time Dashboards Enable | Track OEE and downtime in real-time Predictive maintenance using sensor data Dynamic inventory heat maps Quality linked to operators |
| 3. Dashboards That Drive Action | Role-based views (operator to CEO) Embedded alerts like “Line 4 down for 15+ mins” Drilldowns from plant-level to machine-level |
| 4. What Powers These Dashboards | Unified Data Lakehouse (ERP + IoT + MES) Real-time ETL pipelines Power BI or custom dashboards built for frontline usability |
Smart Manufacturing dashboards aren’t just analytics tools—they’re productivity engines. Dashboards that deliver real-time insight empower frontline teams to make faster, better decisions—whether it’s adjusting production schedules, triggering preventive maintenance, or responding to inventory fluctuations.
Explore how Mantra Labs can help you unlock operations intelligence that’s actually usable.
Knowledge thats worth delivered in your inbox


Our Sales Team will be in touch with you shortly.

Hello Stranger! Please fill in a few details,and you’ll receive a link to this case study.
 We have mailed you this case study.
Thanks for subscribing.
