


4 minutes, 33 seconds read
Published on Nov 12, 2019
Updated on May 18, 2020
Create superior customer experiences to enhance competitive advantage.
Go from zero to breakthrough with scalable, future-proof solutions.
Harness deep tech for smarter solutions and maximum impact.
Accelerate value delivery with powerful pre-built digital tools.
Help businesses connect with an internet first generation.
Test the smarter way: where precision meets efficiency.
Unlock real-time and personalized customer journeys for mobile first generation.
Turn data into decisive action with scalable AI infrastructure.
Design agile digital foundations that scale with tomorrow's business needs.
Build new-age architecture for maximum efficiency and hyper-growth.
Fine-tune your cloud infrastructure for peak performance.
Automated compliance and control for global regulations.

All
Customer Experience
Mantra
Application Development
Insurtech
Digital Health
Insurance
Deep-Tech
AgriTech(1)
Augmented Reality(21)
Clean Tech(9)
Customer Journey(17)
Design(45)
Solar Industry(8)
User Experience(68)
Edtech(10)
Events(34)
HR Tech(3)
Interviews(10)
Life@mantra(11)
Logistics(6)
Manufacturing(5)
Strategy(18)
Testing(9)
Android(48)
Backend(32)
Dev Ops(11)
Enterprise Solution(33)
Technology Modernization(9)
Frontend(29)
iOS(43)
Javascript(15)
AI in Insurance(41)
Insurtech(67)
Product Innovation(59)
Solutions(22)
E-health(12)
HealthTech(25)
mHealth(5)
Telehealth Care(4)
Telemedicine(5)
Artificial Intelligence(154)
Bitcoin(8)
Blockchain(19)
Cognitive Computing(8)
Computer Vision(8)
Data Science(24)
FinTech(51)
Banking(7)
Intelligent Automation(27)
Machine Learning(48)
Natural Language Processing(14)
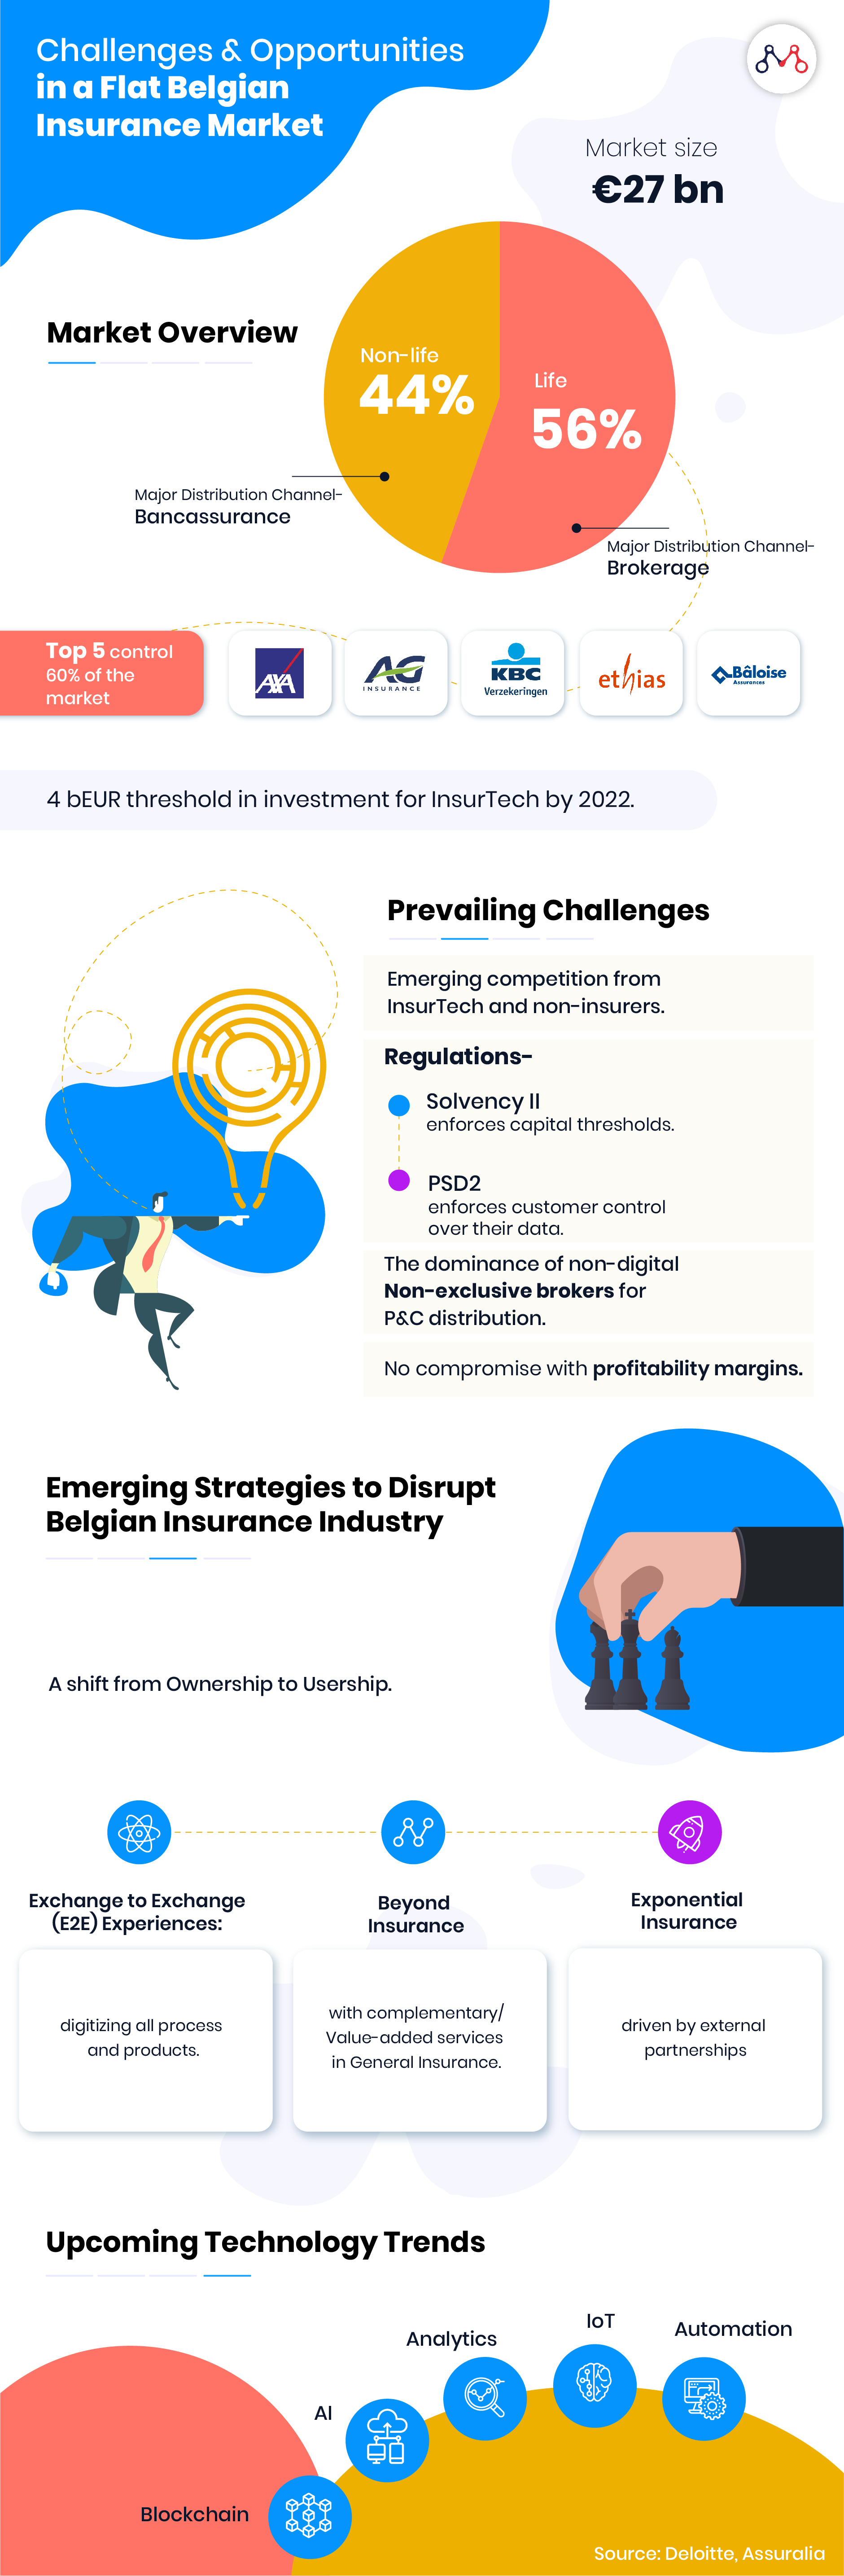
The market for insurance in Belgium has been stable for over a decade. Unless Insurers adopt new strategies and embrace external partnerships, organic growth seems next to impossible.
While insurers in other parts of the world are leveraging technology for better customer acquisition, Belgian Insurers struggle with stringent customer data protection laws.
This is the time for major business alignments to keep up with the changing customer expectations. For instance, the brokerage system dominates nearly 60% of non-life insurance distribution in Belgium. Unfortunately, 31% of the brokers have a negative attitude towards digitization and InsurTech, mainly because of the lack of awareness about the subject.
With current business models, there’s negligible hope that Belgian Insurers will remain competitive. Let’s look at the key drivers of ‘change’.
The threat to lose customers for being slow in a fast-moving age is imposing some serious pressure on Insurers in Belgium. The change in customer expectations and lifestyle will drive the transformation of the Belgium Insurance Industry. The other factors that will impact the insurance include- economy, technology, life expectancy, climate change, and competition.
The Deloitte Global Mobile Consumer Survey 2018 reveals— 84% of Belgians own at least one mobile device. This indicates a growing preference for digital, self-service platforms, and ease of access irrespective of location. Insurers are, thus, compelled to look beyond agent-driven pitches.
For example, Trov— an American technology company provides ‘on-demand’ insurance for individuals’ properties for short durations. Customers only need to register their properties, activate insurance for a desired duration, and pay a daily premium.
Now that over 60% of non-life insurance products are distributed by brokers, this is also the time to train and equip brokers with handy apps.
The world is rapidly moving towards a sharing economy, which involves short-term P2P (Peer-to-peer) transactions for shared use of products and services. The societal shift towards the open data economy fueled the open banking trend. Recently, insurers are following the trend as open insurance.
“..The economy has been moving beyond narrowly defined industries built around large, vertically integrated, and mainly “self-contained” corporations. New means of creating value have been developing everywhere in the form of ever-denser and richer networks of connection, collaboration, and interdependence…” (Business ecosystems come of age. Kelly, E., 1 April 2015, p. 4.)
Belgium is set to witness the following major economic shifts-
Digital has put customers in the center. While other industries stay ahead with technological adoption, Insurers need to invest in innovative products that cover emerging risks. For example, Spotify’s personalized recommendations and Apple’s assistant – Siri are setting a benchmark for customizing the products at an individual level. “Yet what has become the new normal for those companies, remains a challenge for insurers,” says Dirk Vanderschrick, CEO, Belfius.
The Insurance industry in Belgium is yet to adopt biometrics, recommender systems, sentiment detection, and natural language generation. Currently, 60% of Belgian Insurers use text analysis; 40% use chatbots and object detection; 20% exercise automated decision making and pattern detection; according to Monitor Deloitte’s One Minute Survey, Artificial Intelligence (May 2018).
Apart from AI-enabled tools, the Belgium Insurance sector will soon adopt blockchain, Automation, Analytics, XaaS, and IoT.
Related articles – 5 AI trends reshaping the Insurance sector , How does XaaS help your business, Blockchain in Insurance
Today, business models have a shorter life cycle because of digital disruption. The competition for incumbents is fierce- with 4 bEUR potential investment in InsurTech in Belgium.
Many have thought of phygital experience as progressive- where paper and paperless processes coexist. However, in the long term, their existence is questionable. For example, Lemonade is racing the core insurance with paperless and personalized insurance packages delivered to the customer in just 90 seconds!
In line with the fact that customers want a solution to their problems – the one who provides the most appropriate solution in the easiest way possible, wins.
Compulsory health and car insurance policies had a great impact on sales volume. Apart from being an entry barrier for small players, the existing regulations no more align with climate changes, longevity, and technological disruptions.
The Belgian Government is set to launch Payment Service Directive 2 (PSD2) by 2024 and IFRS 17 (International Financial Reporting Standard) by 2021. Nearly 70% of Insurers believe PSD2 will have a positive impact in the insurance value chain.
According to Insurance Experts from Deloitte, non-core insurance products and services drive 10-30% of the revenue. Therefore, complementary services or value-added services can bring a greater competitive advantage to the insurers.
For example, the US-based Oscar Health Insurance encourages a healthy lifestyle by financially rewarding its customers. It tracks footsteps, eating habits, workouts, etc. on its app through wearables. It further supports customers with doctoral advice and scheduling appointments. These value-added services, along with traditional health insurance is a win for customer loyalty.
We’re an InsurTech100 company championing back and front-office automation solutions along with interactive applications for the new-age digital insurer. Drop us a line at hello@mantralabsglobal.com to know more.
Knowledge thats worth delivered in your inbox
Smart Manufacturing starts with real-time visibility.
Manufacturing companies today generate data by the second through sensors, machines, ERP systems, and MES platforms. But without real-time insights, even the most advanced production lines are essentially flying blind.
Manufacturers are implementing real-time dashboards that serve as control towers for their daily operations, enabling them to shift from reactive to proactive decision-making. These tools are essential to the evolution of Smart Manufacturing, where connected systems, automation, and intelligent analytics come together to drive measurable impact.
Data is available, but what’s missing is timely action.
For many plant leaders and COOs, one challenge persists: operational data is dispersed throughout systems, delayed, or hidden in spreadsheets. And this delay turns into a liability.
Real-time dashboards help uncover critical answers:
By converting raw inputs into real-time manufacturing analytics, dashboards make operational intelligence accessible to operators, supervisors, and leadership alike, enabling teams to anticipate problems rather than react to them.
Line performance and downtime trends
Track OEE in real time and identify underperforming lines.
Predictive maintenance alerts
Utilize historical and sensor data to identify potential part failures in advance.
Inventory heat maps & reorder thresholds
Anticipate stockouts or overstocks based on dynamic reorder points.
Quality metrics linked to operator actions
Isolate shifts or procedures correlated with spikes in defects or rework.
These insights allow production teams to drive day-to-day operations in line with Smart Manufacturing principles.
Role-based dashboards
Dashboards can be configured for machine operators, shift supervisors, and plant managers, each with a tailored view of KPIs.
Embedded alerts and nudges
Real-time prompts, like “Line 4 below efficiency threshold for 15+ minutes,” reduce response times and minimize disruptions.
Cross-functional drill-downs
Teams can identify root causes more quickly because users can move from plant-wide overviews to detailed machine-level data in seconds.
Data lakehouse integration
Unified access to ERP, MES, IoT sensor, and QA systems—ensuring reliable and timely manufacturing analytics.
ETL pipelines
Real-time data ingestion from high-frequency sources with minimal latency.
Visualization tools
Custom builds using Power BI, or customized solutions designed for frontline usability and operational impact.
Mantra Labs partnered with a North American die-casting manufacturer to unify its operational data into a real-time dashboard. Fragmented data, manual reporting, delayed pricing decisions, and inconsistent data quality hindered operational efficiency and strategic decision-making.
As this case shows, real-time dashboards are not just operational tools—they’re strategic enablers.
(Learn More: Powering the Future of Metal Manufacturing with Data Engineering)
| Aspect | What You Should Know |
| 1. Why Static Reports Fall Short | Delayed insights after issues occur Disconnected systems (ERP, MES, sensors) No real-time alerts or embedded decision logic |
| 2. What Real-Time Dashboards Enable | Track OEE and downtime in real-time Predictive maintenance using sensor data Dynamic inventory heat maps Quality linked to operators |
| 3. Dashboards That Drive Action | Role-based views (operator to CEO) Embedded alerts like “Line 4 down for 15+ mins” Drilldowns from plant-level to machine-level |
| 4. What Powers These Dashboards | Unified Data Lakehouse (ERP + IoT + MES) Real-time ETL pipelines Power BI or custom dashboards built for frontline usability |
Smart Manufacturing dashboards aren’t just analytics tools—they’re productivity engines. Dashboards that deliver real-time insight empower frontline teams to make faster, better decisions—whether it’s adjusting production schedules, triggering preventive maintenance, or responding to inventory fluctuations.
Explore how Mantra Labs can help you unlock operations intelligence that’s actually usable.
Knowledge thats worth delivered in your inbox


Our Sales Team will be in touch with you shortly.

Hello Stranger! Please fill in a few details,and you’ll receive a link to this case study.
 We have mailed you this case study.
Thanks for subscribing.
