4 minutes, 42 seconds read
Published on Nov 20, 2019
Updated on May 10, 2020
Create superior customer experiences to enhance competitive advantage.
Go from zero to breakthrough with scalable, future-proof solutions.
Harness deep tech for smarter solutions and maximum impact.
Accelerate value delivery with powerful pre-built digital tools.
Help businesses connect with an internet first generation.
Test the smarter way: where precision meets efficiency.
Unlock real-time and personalized customer journeys for mobile first generation.
Turn data into decisive action with scalable AI infrastructure.
Design agile digital foundations that scale with tomorrow's business needs.
Build new-age architecture for maximum efficiency and hyper-growth.
Fine-tune your cloud infrastructure for peak performance.
Automated compliance and control for global regulations.

All
Customer Experience
Mantra
Application Development
Insurtech
Digital Health
Insurance
Deep-Tech
AgriTech(1)
Augmented Reality(21)
Clean Tech(9)
Customer Journey(17)
Design(45)
Solar Industry(8)
User Experience(68)
Edtech(10)
Events(34)
HR Tech(3)
Interviews(10)
Life@mantra(11)
Logistics(6)
Manufacturing(5)
Strategy(18)
Testing(9)
Android(48)
Backend(32)
Dev Ops(11)
Enterprise Solution(33)
Technology Modernization(9)
Frontend(29)
iOS(43)
Javascript(15)
AI in Insurance(41)
Insurtech(67)
Product Innovation(59)
Solutions(22)
E-health(12)
HealthTech(25)
mHealth(5)
Telehealth Care(4)
Telemedicine(5)
Artificial Intelligence(154)
Bitcoin(8)
Blockchain(19)
Cognitive Computing(8)
Computer Vision(8)
Data Science(24)
FinTech(51)
Banking(7)
Intelligent Automation(27)
Machine Learning(48)
Natural Language Processing(14)
Predictive Analytics is disrupting the business-consumer dynamic. To improve engagement with their customers, organizations have begun identifying potential segments (predictive audiences) that are likely to convert with them. Modelling data to learn about the potential ‘new’ customer, their preferences and spending behaviour has already proven demonstrably higher conversion rates and lower churn rates. In fact, the market value for these types of services is expected to touch $12.4B by 2022.
As we transition into a semi-connected world supported by global IoT sensors and devices, the real-time analysis of past and future-probable events is evolving business actions more prescriptive in nature. Every touch or interaction triggered by an individual customer is a data point that is captured, stored and examined for insights. Data is an interminable asset that continues to grow exponentially while storage likewise is getting cheaper each year. With nearly infinite cloud computing and scaling it becomes much easier to process these extremely large amounts of data.
But, are customer journeys actually getting better? Are these journeys still reactive? How much of the world has moved to a predictive-first approach? and, has it really helped CXOs address their business goals? Let’s evaluate the state of real-time predictive trends that are being put to use by global enterprises.
First, let’s look at some easily identifiable use cases that have some verifiable results.
The total number of journey interactions the world over is an unquantifiable number. It is predicted, though, that there will be nearly 2MB of data created by every individual in 2020, every second. With all this data to go around, why are companies so invested in them? It’s because customer experience has become the number one marketing activity of 2019, and will continue to rank highly over the next five years.
In fact, Gartner predicts by 2019 more than 50% of organizations will redirect their investments to customer experience innovations. For SaaS enterprises, there is a lot to gain. Research indicates CX initiatives can double an organization’s revenues within 36 months, and this extra share will come from the customer’s wallet. Good CX will create real value for your customers, which means they will spend more.
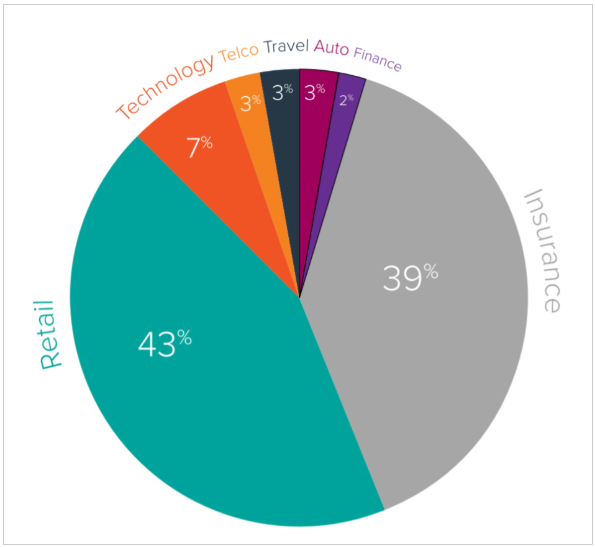
According to Accenture, 87% of organizations agree on traditional experiences no longer satisfy customers. To counter this, Businesses are now investing in customer journey management. Interestingly, insurance (39%) is showing the highest adoption rates outside of retail (42%). The tech industry comes up third behind them at 7%.
Customer journeys are orchestrated into three: Acquisition, Conversion and Growth. Majority of journeys are identified as growth journeys (64%), and typically run for nearly 34 months on average.
Yes, and there’s data to support it.
The predictive journey allows businesses to place real-time marketing bets on the behaviour of the customer. We don’t have to look any further than the example of Netflix and its impressive predictive recommendation system. Almost 80% of the content watched on Netflix is attributed to recommendations. A robust predictive analytical engine working behind the scenes is able to perform two critical aspects of the customer life cycle: Needs forecasting and churn reduction. The system is estimated to save Netflix at least $1 billion each year in customer retention.
The short and long answer is yes.
According to a salesforce study, the key to building highly personalised journeys begins with predictive intelligence. The report found on average, predictive intelligence recommendations influenced 34.7% of total buys. The lift in conversion rate within the first 36 months is around 23%, which is significantly high. Imagine what 23% more in conversions can do for any business. The real value from predictive intelligence is that it gets more intuitive with time. After 36 months of implementation, there is 40.3% more influence in revenue from this technology.
For future engagements, customers want businesses to proactively reach out to them and offer them tailored products and services that will be highly relevant to their needs. On the other hand, businesses prefer to study their consumers by looking at their data under the strict regulations enforced in data privacy laws — because it will certainly avoid long term risk to their business models. The results are clear: A predictive journey is the only way forward.
Mantra Labs is an Insurtech100 company creating AI-first products and solutions for the evolving digital enterprise. To learn more about how we are using predictive journeys to create the Internet of Intelligent Experiences™, reach out to us on hello@mantralabsglobal.com.
Knowledge thats worth delivered in your inbox
Smart Manufacturing starts with real-time visibility.
Manufacturing companies today generate data by the second through sensors, machines, ERP systems, and MES platforms. But without real-time insights, even the most advanced production lines are essentially flying blind.
Manufacturers are implementing real-time dashboards that serve as control towers for their daily operations, enabling them to shift from reactive to proactive decision-making. These tools are essential to the evolution of Smart Manufacturing, where connected systems, automation, and intelligent analytics come together to drive measurable impact.
Data is available, but what’s missing is timely action.
For many plant leaders and COOs, one challenge persists: operational data is dispersed throughout systems, delayed, or hidden in spreadsheets. And this delay turns into a liability.
Real-time dashboards help uncover critical answers:
By converting raw inputs into real-time manufacturing analytics, dashboards make operational intelligence accessible to operators, supervisors, and leadership alike, enabling teams to anticipate problems rather than react to them.
Line performance and downtime trends
Track OEE in real time and identify underperforming lines.
Predictive maintenance alerts
Utilize historical and sensor data to identify potential part failures in advance.
Inventory heat maps & reorder thresholds
Anticipate stockouts or overstocks based on dynamic reorder points.
Quality metrics linked to operator actions
Isolate shifts or procedures correlated with spikes in defects or rework.
These insights allow production teams to drive day-to-day operations in line with Smart Manufacturing principles.
Role-based dashboards
Dashboards can be configured for machine operators, shift supervisors, and plant managers, each with a tailored view of KPIs.
Embedded alerts and nudges
Real-time prompts, like “Line 4 below efficiency threshold for 15+ minutes,” reduce response times and minimize disruptions.
Cross-functional drill-downs
Teams can identify root causes more quickly because users can move from plant-wide overviews to detailed machine-level data in seconds.
Data lakehouse integration
Unified access to ERP, MES, IoT sensor, and QA systems—ensuring reliable and timely manufacturing analytics.
ETL pipelines
Real-time data ingestion from high-frequency sources with minimal latency.
Visualization tools
Custom builds using Power BI, or customized solutions designed for frontline usability and operational impact.
Mantra Labs partnered with a North American die-casting manufacturer to unify its operational data into a real-time dashboard. Fragmented data, manual reporting, delayed pricing decisions, and inconsistent data quality hindered operational efficiency and strategic decision-making.
As this case shows, real-time dashboards are not just operational tools—they’re strategic enablers.
(Learn More: Powering the Future of Metal Manufacturing with Data Engineering)
| Aspect | What You Should Know |
| 1. Why Static Reports Fall Short | Delayed insights after issues occur Disconnected systems (ERP, MES, sensors) No real-time alerts or embedded decision logic |
| 2. What Real-Time Dashboards Enable | Track OEE and downtime in real-time Predictive maintenance using sensor data Dynamic inventory heat maps Quality linked to operators |
| 3. Dashboards That Drive Action | Role-based views (operator to CEO) Embedded alerts like “Line 4 down for 15+ mins” Drilldowns from plant-level to machine-level |
| 4. What Powers These Dashboards | Unified Data Lakehouse (ERP + IoT + MES) Real-time ETL pipelines Power BI or custom dashboards built for frontline usability |
Smart Manufacturing dashboards aren’t just analytics tools—they’re productivity engines. Dashboards that deliver real-time insight empower frontline teams to make faster, better decisions—whether it’s adjusting production schedules, triggering preventive maintenance, or responding to inventory fluctuations.
Explore how Mantra Labs can help you unlock operations intelligence that’s actually usable.
Knowledge thats worth delivered in your inbox


Our Sales Team will be in touch with you shortly.

Hello Stranger! Please fill in a few details,and you’ll receive a link to this case study.
 We have mailed you this case study.
Thanks for subscribing.