


5 minutes read
Published on May 7, 2019
Updated on Apr 17, 2020
Create superior customer experiences to enhance competitive advantage.
Go from zero to breakthrough with scalable, future-proof solutions.
Harness deep tech for smarter solutions and maximum impact.
Accelerate value delivery with powerful pre-built digital tools.
Help businesses connect with an internet first generation.
Test the smarter way: where precision meets efficiency.
Unlock real-time and personalized customer journeys for mobile first generation.
Turn data into decisive action with scalable AI infrastructure.
Design agile digital foundations that scale with tomorrow's business needs.
Build new-age architecture for maximum efficiency and hyper-growth.
Fine-tune your cloud infrastructure for peak performance.
Automated compliance and control for global regulations.

All
Customer Experience
Mantra
Application Development
Insurtech
Digital Health
Insurance
Deep-Tech
AgriTech(1)
Augmented Reality(21)
Clean Tech(9)
Customer Journey(17)
Design(45)
Solar Industry(8)
User Experience(68)
Edtech(10)
Events(34)
HR Tech(3)
Interviews(10)
Life@mantra(11)
Logistics(6)
Manufacturing(5)
Strategy(18)
Testing(9)
Android(48)
Backend(32)
Dev Ops(11)
Enterprise Solution(33)
Technology Modernization(9)
Frontend(29)
iOS(43)
Javascript(15)
AI in Insurance(41)
Insurtech(67)
Product Innovation(59)
Solutions(22)
E-health(12)
HealthTech(25)
mHealth(5)
Telehealth Care(4)
Telemedicine(5)
Artificial Intelligence(154)
Bitcoin(8)
Blockchain(19)
Cognitive Computing(8)
Computer Vision(8)
Data Science(24)
FinTech(51)
Banking(7)
Intelligent Automation(27)
Machine Learning(48)
Natural Language Processing(14)
We need to test websites and applications for performance standards before delivering them to the client. The performance or benchmark testing is an ongoing function of software quality assurance that extends throughout the life cycle of the project. To build standards into the architecture of a system — the stability and response time of an application is extensively tested by applying a load or stress to the system.
Essentially, ‘load’ means the number of users using the application while ‘stability’ refers to the system’s ability to withstand the load created by the intended number of users. ‘Response time’ indicates the time taken to send a request, run the program and receive a response from a server.
Load testing on applications can be a challenging ordeal if a performance testing strategy is not predetermined. Testing tasks require multifaceted skill-sets — from writing test scripts, monitoring and analyzing test results to tweaking custom codes and scripts, and developing automated test scenarios for the actual testing.
Quality testing ensures that the system is reliable, built for capacity and scalable. To achieve this, the involved stakeholders decide the budget considering its business impact.
Now, this raises a question — how do we predict traffic based on past trends? and how can we make the system more efficient to handle traffic without any dropouts? Also, if and when we hit peak loads, then how are we going to address the additional volume? For this, it is crucial to outline the performance testing strategy beforehand.
Organizations don’t prefer manual testing these days because it is expensive and requires human resources and hardware. It is also quite complex to coordinate and synchronize multiple testers. Also, repeatability is limited in manual testing.
To find the stability and response time of each API, we can test different scenarios by varying the load at different time intervals on the application. We can then automate the application by using any performance testing tool.
There are a bunch of different tools available for testers such as Open Source testing Tools — Open STA Diesel Test, TestMaker, Grinder, LoadSim, J-Meter, Rubis; Commercial testing tools— LoadRunner, Silk Performer, Qengine, Empirix e-Load.
Among these, the most commonly used tool is Apache J-Meter. It is a 100% Java desktop application with a graphical interface that uses the Swing graphical API. It can, therefore, run on any environment/workstation that accepts Java virtual machine, for example, Windows, Linux, Mac, etc.
We can automate testing the application by integrating the ‘selenium scripts’ in the J-Meter tool. (The software that can perform load tests, performance-functional tests, regression tests, etc. on different technologies.)
[Related: A Complete Guide to Regression Testing in Agile]
If the project is large in scope and the number of users keeps increasing day-by-day then the server’s load will be greater. In such situations, Performance testing is useful to identify at what point the application will crash. To find the number of errors and warnings in the code, we use the J-Meter tool.
J-Meter simulates a group of users sending requests to a target server and returns statistics that show the performance/functionality of the target server/application via tables, graphs, etc.
The following figure illustrates how J-Meter works:
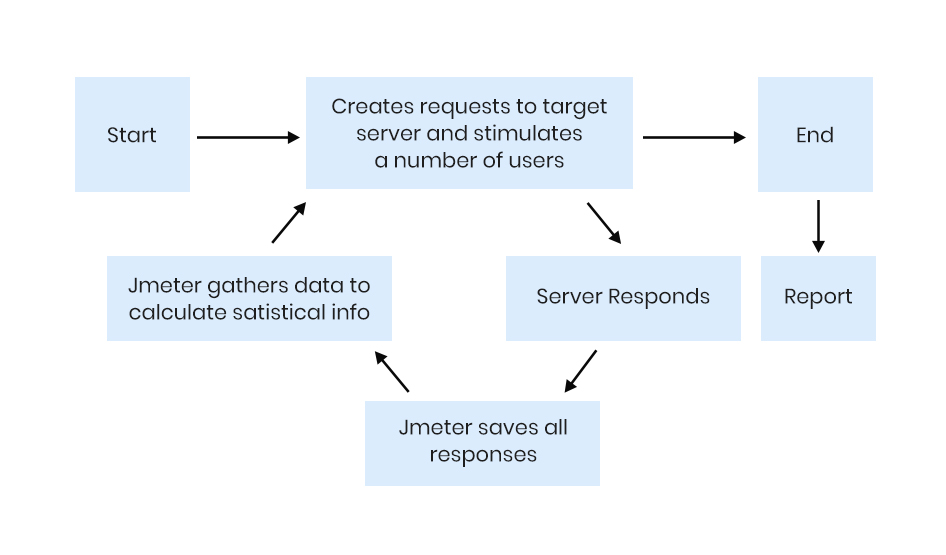
The J-Meter performance testing tool can find the performance of any application (no matter whatever the language used to build the project).
First, it requires a test plan which describes a series of steps that the J-Meter will execute when run. A complete test plan will consist of one or more thread groups, samplers, logic controllers, listeners, timers, assertions and configuration elements.
The ‘thread’ group elements are the beginning of any test plan. Thread group element controls the number of threads J-Meter will use during the test run. We can also control the following via thread group: setting the number of threads, setting the ramp-up time and setting the loop count. The number of threads implies the number of users to the server application, while the ramp-up period defines the time taken by J-Meter to get all the threads running. Loop count identifies the number of times to execute the test.
After creating the ‘thread’ group, we need to define the number of users, iterations and ramp-up time (or usage time). We can create virtual servers depending on the number of users defined in the thread group and start performing the action based on the parameters defined. Internally J-Meter will record all the results like response code, response time, throughput, latency, etc. It produces the results in the form of graphs, trees and tables.
J-Meter has two types of controllers: Samplers and Logic controllers. Samplers allow the J-Meter to send specific requests to a server, while Logic controllers control the order of processing of samplers in a thread. They can change the order of requests coming from any of their child elements. Listeners are then used to view the results of samplers in the form of reporting tables, graphs, trees or simple text in some log files.
Please remember, always do performance testing by changing one parameter at a time. This way, you’ll be able to monitor response and throughput metrics and correct discrepancies accordingly. The real purpose of load testing is to ensure that the application or site is functional for businesses to deliver real value to their users — so test practically, and think like a real user.
If you’ve any queries or doubts, please feel free to write to hello@mantralabsglobal.com.
About the author: Syed Khalid Hussain is a Software Engineer-QA at Mantra Labs Pvt Ltd. He is a pro at different QA testing methodologies and is integral to the organization’s testing services.
Load testing is done to ensure that the application is capable of withstanding the load created by the intended number of users (web traffic).
There are open source and commercial tools available for load testing.
Open Source Tools are — Open STA Diesel Test, TestMaker, Grinder, LoadSim, J-Meter, Rubis. Commercial testing tools are — LoadRunner, Silk Performer, Qengine, Empirix e-Load.
Load testing is done using test scripts, monitoring and analyzing test results and developing automated test scenarios.
Check out these articles to catch the latest trends in mobile apps:
Knowledge thats worth delivered in your inbox
Smart Manufacturing starts with real-time visibility.
Manufacturing companies today generate data by the second through sensors, machines, ERP systems, and MES platforms. But without real-time insights, even the most advanced production lines are essentially flying blind.
Manufacturers are implementing real-time dashboards that serve as control towers for their daily operations, enabling them to shift from reactive to proactive decision-making. These tools are essential to the evolution of Smart Manufacturing, where connected systems, automation, and intelligent analytics come together to drive measurable impact.
Data is available, but what’s missing is timely action.
For many plant leaders and COOs, one challenge persists: operational data is dispersed throughout systems, delayed, or hidden in spreadsheets. And this delay turns into a liability.
Real-time dashboards help uncover critical answers:
By converting raw inputs into real-time manufacturing analytics, dashboards make operational intelligence accessible to operators, supervisors, and leadership alike, enabling teams to anticipate problems rather than react to them.
Line performance and downtime trends
Track OEE in real time and identify underperforming lines.
Predictive maintenance alerts
Utilize historical and sensor data to identify potential part failures in advance.
Inventory heat maps & reorder thresholds
Anticipate stockouts or overstocks based on dynamic reorder points.
Quality metrics linked to operator actions
Isolate shifts or procedures correlated with spikes in defects or rework.
These insights allow production teams to drive day-to-day operations in line with Smart Manufacturing principles.
Role-based dashboards
Dashboards can be configured for machine operators, shift supervisors, and plant managers, each with a tailored view of KPIs.
Embedded alerts and nudges
Real-time prompts, like “Line 4 below efficiency threshold for 15+ minutes,” reduce response times and minimize disruptions.
Cross-functional drill-downs
Teams can identify root causes more quickly because users can move from plant-wide overviews to detailed machine-level data in seconds.
Data lakehouse integration
Unified access to ERP, MES, IoT sensor, and QA systems—ensuring reliable and timely manufacturing analytics.
ETL pipelines
Real-time data ingestion from high-frequency sources with minimal latency.
Visualization tools
Custom builds using Power BI, or customized solutions designed for frontline usability and operational impact.
Mantra Labs partnered with a North American die-casting manufacturer to unify its operational data into a real-time dashboard. Fragmented data, manual reporting, delayed pricing decisions, and inconsistent data quality hindered operational efficiency and strategic decision-making.
As this case shows, real-time dashboards are not just operational tools—they’re strategic enablers.
(Learn More: Powering the Future of Metal Manufacturing with Data Engineering)
| Aspect | What You Should Know |
| 1. Why Static Reports Fall Short | Delayed insights after issues occur Disconnected systems (ERP, MES, sensors) No real-time alerts or embedded decision logic |
| 2. What Real-Time Dashboards Enable | Track OEE and downtime in real-time Predictive maintenance using sensor data Dynamic inventory heat maps Quality linked to operators |
| 3. Dashboards That Drive Action | Role-based views (operator to CEO) Embedded alerts like “Line 4 down for 15+ mins” Drilldowns from plant-level to machine-level |
| 4. What Powers These Dashboards | Unified Data Lakehouse (ERP + IoT + MES) Real-time ETL pipelines Power BI or custom dashboards built for frontline usability |
Smart Manufacturing dashboards aren’t just analytics tools—they’re productivity engines. Dashboards that deliver real-time insight empower frontline teams to make faster, better decisions—whether it’s adjusting production schedules, triggering preventive maintenance, or responding to inventory fluctuations.
Explore how Mantra Labs can help you unlock operations intelligence that’s actually usable.
Knowledge thats worth delivered in your inbox


Our Sales Team will be in touch with you shortly.

Hello Stranger! Please fill in a few details,and you’ll receive a link to this case study.
 We have mailed you this case study.
Thanks for subscribing.
