


3 minutes, 33 seconds read
Published on Jul 15, 2020
Updated on Jul 16, 2020
Create superior customer experiences to enhance competitive advantage.
Go from zero to breakthrough with scalable, future-proof solutions.
Harness deep tech for smarter solutions and maximum impact.
Accelerate value delivery with powerful pre-built digital tools.
Help businesses connect with an internet first generation.
Test the smarter way: where precision meets efficiency.
Unlock real-time and personalized customer journeys for mobile first generation.
Turn data into decisive action with scalable AI infrastructure.
Design agile digital foundations that scale with tomorrow's business needs.
Build new-age architecture for maximum efficiency and hyper-growth.
Fine-tune your cloud infrastructure for peak performance.
Automated compliance and control for global regulations.

All
Customer Experience
Mantra
Application Development
Insurtech
Digital Health
Insurance
Deep-Tech
AgriTech(1)
Augmented Reality(21)
Clean Tech(9)
Customer Journey(17)
Design(45)
Solar Industry(8)
User Experience(68)
Edtech(10)
Events(34)
HR Tech(3)
Interviews(10)
Life@mantra(11)
Logistics(6)
Manufacturing(5)
Strategy(18)
Testing(9)
Android(48)
Backend(32)
Dev Ops(11)
Enterprise Solution(33)
Technology Modernization(9)
Frontend(29)
iOS(43)
Javascript(15)
AI in Insurance(41)
Insurtech(67)
Product Innovation(59)
Solutions(22)
E-health(12)
HealthTech(25)
mHealth(5)
Telehealth Care(4)
Telemedicine(5)
Artificial Intelligence(154)
Bitcoin(8)
Blockchain(19)
Cognitive Computing(8)
Computer Vision(8)
Data Science(24)
FinTech(51)
Banking(7)
Intelligent Automation(27)
Machine Learning(48)
Natural Language Processing(14)
It’s very human to skip tests. But, while developing enterprise apps, testing is something that should never be compromised. If you don’t test, there will be no way to find out the application performance and determine user experiences.
Testing is a must! You might already know that you should write tests for your code and UI, but you might not know — how? I’ll walk you through types of tests that developers usually perform on Swift programming language in order to help you deliver a supreme-quality app to your user.
Whether you’re building a new application or expanding the existing app, you might want to test it on the go. Testing in swift is as simple as building the app itself. (For your information, the Xcode also tests the application). All you need is test cases and an idea about where code usually goes wrong.
But first, it’s necessary to find out what to test.
Start with the basics. You must write mandatory tests if you plan to expand the application.
Tests usually cover the following issues.
Let’s take a quick look at the types of testing while developing an app in Swift.
It is a process of creating small functionality-based tests for a particular unit of code, which will eventually ensure that all other units will pass the test.
The Test navigator provides the easiest way to work with tests; you’ll use it to create test targets and run tests against your app.
UI testing is useful for testing interactions with the User interface. In UI testing, the developer needs to find the app’s UI objects through queries, synthesizing events. Tester has to then send the events to those objects. The API lets you examine the UI object’s properties and state which you can compare against the expected state.
A performance test uses a block of code that you want to evaluate. It is then run 10 times to collect the average execution time and the standard deviation for the runs. The average of these individual measurements (of the test run) are compared against the from a benchmark value to evaluate the success/failure of the project.
It’s very simple to write a performance test: You just place the code you want to measure into the closure of the measure().
The code coverage tool tells you about the parts of code that were actually executed during your tests. This way, you’ll know the parts of the app code that aren’t yet tested.
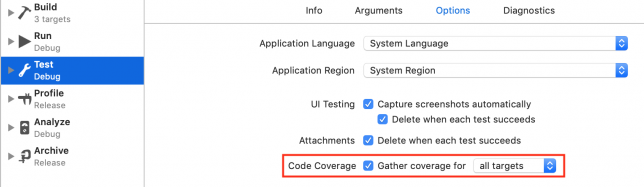
You can enable code coverage by editing the scheme’s Test action. Post this, check the Gather coverage for check box under the Options tab:
Now:
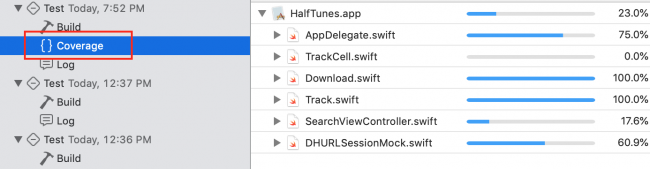
You can see the list of functions and closures in SearchViewController.swift by clicking the disclosure triangle:
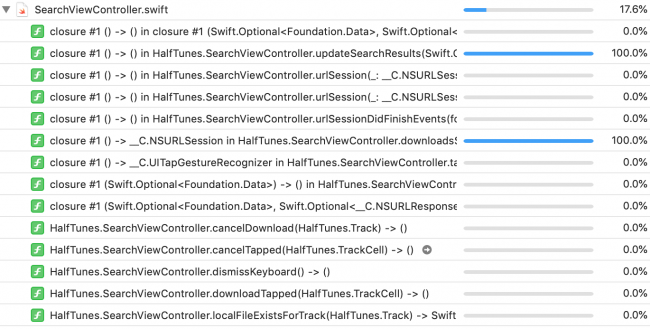
Scroll down to updateSearchResults(_:) to see that coverage is 87.9%.
Now:
Click the arrow button for this function to open the source file to the function. As you hover over the coverage annotations in the right sidebar, sections of code highlight green or red:
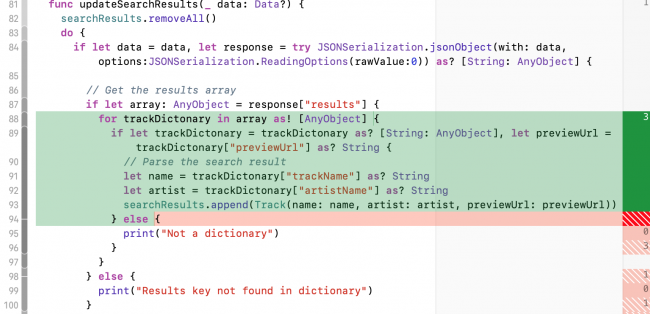
The coverage annotations show how many times a test hits each code section. Sections that weren’t called are highlighted in red. This implies — the for-loop ran 3 times, but nothing in the error paths were executed.
You can also increase the coverage of this function by duplicating abbaData.json, then edit it so it causes the different errors. For example, change “results” to “result” for a test that hits print(“Results key not found in dictionary”).
We help enterprises mitigate technical & business risk by securing vulnerable blind spots. Check out our testing services.
For your specific requirements, please feel free to drop us a word at hello@mantralabsglobal.com
About the author:
Anand Nanavaty is a Software Engineer with Mantra Labs. He has been deeply involved in mobile app development for the company’s B2B clients. Apart from coding, testing and experimenting with different application development frameworks, Anand loves travelling, trekking, mountaineering, sports (especially cricket), watching movies and sometimes making short films.
Further reading:
For in-depth understanding of testing in Swift, you can refer to — Writing Test Classes and Methods
Knowledge thats worth delivered in your inbox
Smart Manufacturing starts with real-time visibility.
Manufacturing companies today generate data by the second through sensors, machines, ERP systems, and MES platforms. But without real-time insights, even the most advanced production lines are essentially flying blind.
Manufacturers are implementing real-time dashboards that serve as control towers for their daily operations, enabling them to shift from reactive to proactive decision-making. These tools are essential to the evolution of Smart Manufacturing, where connected systems, automation, and intelligent analytics come together to drive measurable impact.
Data is available, but what’s missing is timely action.
For many plant leaders and COOs, one challenge persists: operational data is dispersed throughout systems, delayed, or hidden in spreadsheets. And this delay turns into a liability.
Real-time dashboards help uncover critical answers:
By converting raw inputs into real-time manufacturing analytics, dashboards make operational intelligence accessible to operators, supervisors, and leadership alike, enabling teams to anticipate problems rather than react to them.
Line performance and downtime trends
Track OEE in real time and identify underperforming lines.
Predictive maintenance alerts
Utilize historical and sensor data to identify potential part failures in advance.
Inventory heat maps & reorder thresholds
Anticipate stockouts or overstocks based on dynamic reorder points.
Quality metrics linked to operator actions
Isolate shifts or procedures correlated with spikes in defects or rework.
These insights allow production teams to drive day-to-day operations in line with Smart Manufacturing principles.
Role-based dashboards
Dashboards can be configured for machine operators, shift supervisors, and plant managers, each with a tailored view of KPIs.
Embedded alerts and nudges
Real-time prompts, like “Line 4 below efficiency threshold for 15+ minutes,” reduce response times and minimize disruptions.
Cross-functional drill-downs
Teams can identify root causes more quickly because users can move from plant-wide overviews to detailed machine-level data in seconds.
Data lakehouse integration
Unified access to ERP, MES, IoT sensor, and QA systems—ensuring reliable and timely manufacturing analytics.
ETL pipelines
Real-time data ingestion from high-frequency sources with minimal latency.
Visualization tools
Custom builds using Power BI, or customized solutions designed for frontline usability and operational impact.
Mantra Labs partnered with a North American die-casting manufacturer to unify its operational data into a real-time dashboard. Fragmented data, manual reporting, delayed pricing decisions, and inconsistent data quality hindered operational efficiency and strategic decision-making.
As this case shows, real-time dashboards are not just operational tools—they’re strategic enablers.
(Learn More: Powering the Future of Metal Manufacturing with Data Engineering)
| Aspect | What You Should Know |
| 1. Why Static Reports Fall Short | Delayed insights after issues occur Disconnected systems (ERP, MES, sensors) No real-time alerts or embedded decision logic |
| 2. What Real-Time Dashboards Enable | Track OEE and downtime in real-time Predictive maintenance using sensor data Dynamic inventory heat maps Quality linked to operators |
| 3. Dashboards That Drive Action | Role-based views (operator to CEO) Embedded alerts like “Line 4 down for 15+ mins” Drilldowns from plant-level to machine-level |
| 4. What Powers These Dashboards | Unified Data Lakehouse (ERP + IoT + MES) Real-time ETL pipelines Power BI or custom dashboards built for frontline usability |
Smart Manufacturing dashboards aren’t just analytics tools—they’re productivity engines. Dashboards that deliver real-time insight empower frontline teams to make faster, better decisions—whether it’s adjusting production schedules, triggering preventive maintenance, or responding to inventory fluctuations.
Explore how Mantra Labs can help you unlock operations intelligence that’s actually usable.
Knowledge thats worth delivered in your inbox


Our Sales Team will be in touch with you shortly.

Hello Stranger! Please fill in a few details,and you’ll receive a link to this case study.
 We have mailed you this case study.
Thanks for subscribing.
